4031| Saudi Ground ServicesBroke out it's cup and handle pattern and now in process of full-filling cup depth.
Now trading on bullish flag which will break at through it at 55 SR.
Full-filling Flag height will take us to 60 SR.
Full-filling flagpole height will take us to 67SR.
At 67 SR its cup depth will be full-filled and completed
Breaking through 67 SR will open for a new wave/rally plus
Details in chart

Bullish on All Time Frames
74.50 - 75.50 is an Important Support Levels
Otherwise, Crossing 84 - 85 may lead it
towards Double Top Zone around 93


Bullish Divergence on Daily TFDouble Bottom around 30
Safe Entry: Above 32.80
Target 35
Stoploss 30 (Closing basis)
Risky Players may take entry at CMP
with Stoploss 28.70 on Closing Basis

Should go for Long??
Though Still Bullish on Weekly TF
But Clear Bearish Divergence on Daily TF
90 is the Breakout level of Monthly Resistance


Walaa cooperative insruance co.Completed Harmonic Pattern
We are expection correction till the target shown on the chart.

2120 - Saudi Advanced IndustriesPotential Harmonic Pattern, not activated yet.
Potential target for long term are shown on the chart.

SAUDI BASIC INDUSTRIES STOCK.WEEKLY ANALYSIS.Hello ladies and gentleman,according my analysis To SAUDI BASIC INDUSTRIES STOCK .there is agreat probability long to 96 SAR.

rest before the taking offthe SAUDI STEEL PIPE CO. is having a rest before the taking off again, you can wait for it to keep
arising

3008| Al Kathiri Holding CompanyBroke out its bullish flag and now in rectangular channel
SMA will become positive at 3 SR level
Flagpole length will take us to 4.5 SR
Rectangular channel hight will take us to 4.9 SR
Break through 4.90 SR level will open a new rising wave/rally
Rest of details in chart
Good luck!

Bullish Divergence on Weekly TF
Ascending Triangle Formation
Breakout Level 101
84 - 85 & then 80 - 81 may act as Good Support
Levels
75 Should Not be Broken!
& If 65 is Broken (in worst case), 25 - 26
levels will be exposed; which is less likely
as Weekly Bullish Divergence can be seen.

8200| Reinsurance stock This idea for long term
Reinsurance stock broke out its cup and handle pattern
Promised to full-fill cup depth which about 315 %
Cup depth will take us from 26 to 85 SR
Good luck!

8200| Reinsurance stock This analysis for short term idea and I will publish another idea for long term
Failed to break through its ascending channel
Now retesting the middle of the channel
Inside the channel just broke out its bluish flag and pending to full-fill its the pole length
Full-filling the pole length will take us to 30.30 SR which is the roof of the channel
After breaking through channel at 30.30 SR, will full-fill the channel length which will take us to 40 SR
Targets, support and, stop loos in chart
Good luck!

4012| Thob Al Aseel CoBroke out it's bluish flag
It gonna turn positive after breaking through 4.90 SR
Current price 4.68 SR
Short term targets 4.90-7.15 SR
7.15 is ATH and its strongest resistant level
The stock is forming cup and handle pattern and 7.15 SR is its the neckline
Breaking through 7.15 will open a new uptrend rally to full-fill the cup depth which about 130 % to 18 SR
Rest of details in analysis including SL
Good luck!

Bullish Divergence on Hourly TF
133 is an Important Level that
should be Crossed & Sustained
for further upside
On the flip side, 122 - 123 is
an Important Support that
seems to be respected

Bullish Divergence on Hourly TF
Double Bottom around 51
54.10 should be Sustained on
Weekly Basis for Further Upside
However, 55.50 is the Initial Resistance
Breaking 50.70 will trigger H&S Pattern
exposing 42 - 43

Brief Review of 4240 Stock on the Saudi Stock Exchange
Investment Details:
- Stock: 4240 (Fawaz Abdul Aziz Al Hukair)
- Quantity: 2000 shares
- Purchase Price: 12.00 SAR
Review:
I recently invested in 4240 stock on the Saudi Stock Exchange, specifically in Fawaz Abdul Aziz Al Hukair. Initially, the investment seemed promising, with the stock priced at 12.00 SAR per share when I purchased 2000 shares.
However, my experience with this investment has been disappointing. Despite the initial optimism, the stock has consistently performed poorly, reaching an all-time low in liquidity. This lack of liquidity has made it difficult to execute trades efficiently and has significantly impacted the overall performance of the investment.
Overall, my experience with 4240 stock has been unsatisfactory, with the low liquidity and poor performance overshadowing any potential gains. I would advise caution to anyone considering investing in this stock until there are signs of improvement in its performance and liquidity on the exchange.

MAHARAH I think the stock will reflect from this level (6.3) to around 7.1. Then we will decide what is the next step. Stop loss is below the least point.

1111: Tadawul Broke out it's ascending channel and bullish flag
Bullish: SMA, EMA and vWAP indicates it's bullishness
Targets 285-340 SR
Support level and rest of details in chart

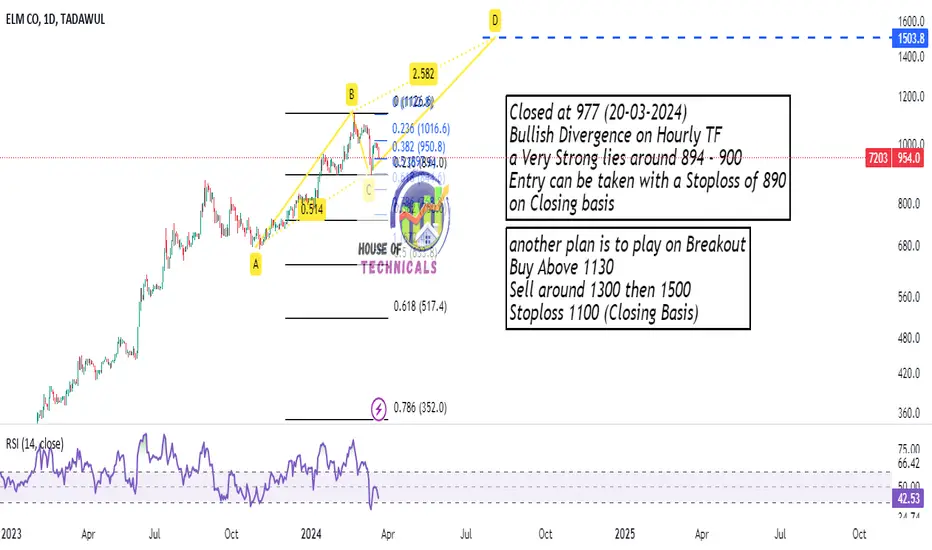
Should wait for Breakout?Closed at 977 (20-03-2024)
Bullish Divergence on Hourly TF
a Very Strong lies around 894 - 900
Entry can be taken with a Stoploss of 890
on Closing basis

4002The price action is rejecting from its supply zone and closed the day at 134.60. At present, support level lies in the range of 127-125 which is the test of ascending trend line. Exercise caution and monitor closely; failure to maintain this level could lead to further downside. On the flip side, upon confirmation of a pullback creates buying opportunity.
