Breakout from a Parallel Channel.
Breakout from a Parallel Channel.
Monthly Closing above 20.20 - 20.30
would be a positive sign.
Re-tested the Breakout leve around 21.20
Stoploss as of now should be 20.20 with
Buy on Dips Strategy.

Al Habib Stock Watch | Development Proposal Impact📈
Symbol: TADAWUL:4013
Sector: Healthcare
Hello traders and investors,
Today I’m analyzing Al Habib Medical Group’s stock performance alongside a key development initiative I personally proposed to Dr. Sulaiman Al Habib himself.
📊 Stock Price Movement
Over the past weeks, Al Habib stock has shown resilience despite broader market fluctuations. We’ve seen support holding around key levels, with buyers stepping in on dips. The technical setup suggests accumulation, possibly in anticipation of new business developments or Q2 earnings.
🧪 Development Proposal – Pharmacy Division
Recently, I submitted a strategic development proposal to Dr. Al Habib focused on enhancing the Pharmacy Department across the group. The proposal includes:
Digital transformation of pharmacy services
Introduction of AI-driven inventory management
Expansion into ePharmacy platforms
Enhancing customer experience and medication adherence via tech
Dr. Al Habib kindly acknowledged the proposal and responded with appreciation, noting that he would refer it to the appropriate person within the organization.
📈 Impact on Stock Price
If implemented, this initiative could have a strong positive impact on revenue and operational efficiency, particularly by:
Increasing pharmacy profitability
Attracting tech-savvy customers
Positioning Al Habib as a leader in healthcare innovation
As investors begin to factor in the potential for tech-driven growth, we may see upward price action as confidence builds.
🔎 Final Thoughts
Keep an eye on news related to internal development or digital health expansion. Strategic innovation, especially in a critical vertical like pharmacy, can be a catalyst for long-term stock appreciation.
Feel free to share your thoughts or technical views in the comments 👇
#AlHabib #4013 #SaudiStocks #PharmacyTech #Innovation #HealthcareStocks #TradingView

MIS 7200 Saudi StockNot financial advice
I like this breakout of this downtrend for the first time in very long period which i think it will reverse hopefully.
Thanks🫶

7030 ZainHello Traders,
This is a weekly chart for Mobile Telecommunications Co Su Arb SJSC.
Since 2023 and Zain has constant Dividends.
With expectant to improve this year too,
It looks like it's ready to the big move next few months.
Good Luck for all

2222 WILL GO LOWERAramco is one of the stocks everyone's wanting to buy, but the problem is all it does is going lower and lower.
As you can notice on the cart, we have both an FVG (highlighted in purple) and a Gap (highlighted in orange), which both the price pulled back on and started going lower.
For now don't buy it, just hold your funds till I post about buying it.
The comment section is all yours for further questions!
Follow for more!

1120 IS PREPARING AN ENTRYDear Saudi Traders,
Been a while since I last posted, and here I am now with the pdates on the market.
We're all aware of the American-Saudi Business situation and how it affected the markets last week, yet we don't know for how long it will last and how lower the markets will get.
However, TASI shows that the price will continue in its normal movement before what happened last weekend.
Now we'll just wait for the market to fill the gap I highlighted in orange to get our entry based on it.
Mots of people lost their money in the market, some lost all of their wallets, my clients too lost a large mount of their portfolio, however we'll get through that and recover.
The comment section is all yours for any questions or help!
Follow for more!

Wait for Weekly Closing..Weekly Closing above 165
would be a +ve sign.
Immediate Targets can be
around 176 - 178 & then 185 - 187.
Trade must be closed if it
breaks 152 as Next Support
will be around 133 - 134.

Long for Nadec The chart is bullish if we don’t close below 27. With possibility for new all time highs.
Disclaimer:
This is not a call to buy the stock

Abo Moati (4191) – Potential Bullish Continuation SetupAfter a strong rally toward SAR 42, Abo Moati has pulled back and is now stabilizing near SAR 38 — a key pivot zone that previously acted as both support and resistance.
We may be looking at a bullish continuation, as the price is attempting to form a higher low. A clean bounce from this zone could offer a favorable risk/reward setup for swing traders.
📊 Technical Context:
4H structure remains bullish after a steep correction
Price is testing a former breakout zone around SAR 38
Momentum is slowing down on the pullback — early signs of buyer interest re-entering
📈 Trade Idea:
Entry: SAR 37.80 – 38.20 (support zone confirmation)
TP1: SAR 41.00 (recent high)
TP2: SAR 43.80 (extension move)
Stop Loss: Below SAR 36.80 (invalidation of structure)
⚠️ Risk Note:
This is a trend-following continuation play, not a reversal. If price loses SAR 37.50 on strong volume, this setup becomes invalid.
🧠 Final Thoughts:
Watch for price action confirmation on the 4H or daily close before entering. No need to catch the exact bottom — let the market show its hand.

Aljazira Takaful (8012) – Bounce from Key Support, More Upside?The stock bounced from a strong support around 14.30 after a steep decline.
Currently testing 14.90 as a key breakout level.
If it holds, targets are set at 15.60 and 16.20, with a stop loss below 14.30.
If it fails, next support lies around 13.70.
Short-term analysis on the 4H timeframe.

8030, Medtrn nd Glf Cptv Insrn nd Rnsn Co SJSCHello,
there is no need for detailed explanation on this stock,
One of my favorite.
Good luck for all

8200, Saudi Reinsurance Company SJSCHello traders,
Saudi Reinsurance Company SJSC is one of the best insurance company in TASI.
Moody's has affirmed its rating at A3 Insurance Financial Strength Rating (IFSR) with Positive outlook.
P/E Ratio: 9.63
Good Luck for all

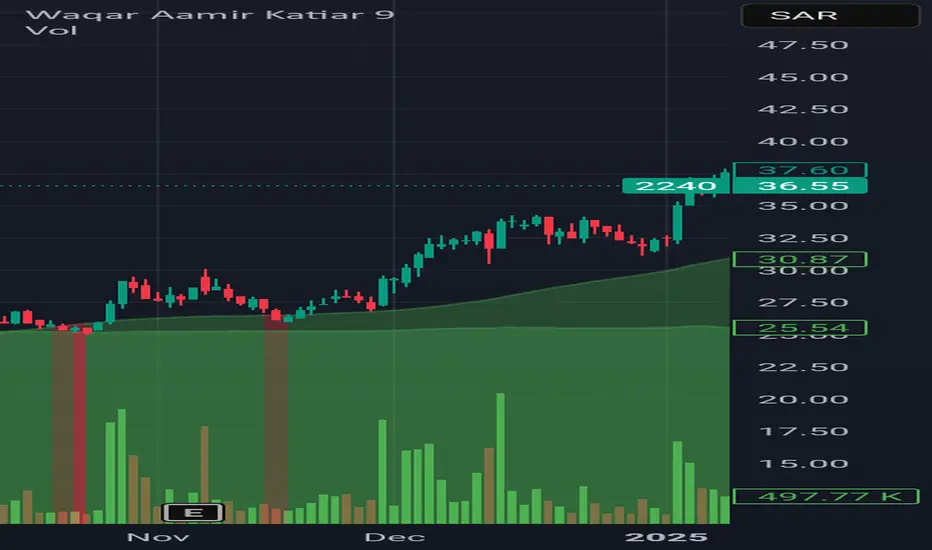
2240 (Zamil Industrial Investment) entered into bullish zone 2240 (Zamil Industrial Investment of Saudi Arabia Stock Exchange) is entered into bullish zone and may fly high.
Note, this is not a buy sell trade call. Trade at your own will.
1120 is entered into bearish zone 1120 (Saudi Arabia Stock Exchange) is entered into bearish zone. It could drop more and rapidly. Fresh buying is not recommended.
Note, this is not a buy sell trade call. Trade at your own will.

Catrion Catering Holding 6004✈️ Aviation-Themed Trading Captions
"Every flight needs a runway — the market is just taxiing before takeoff."
"Before soaring to 179.8, it’s just aligning on the runway. Fasten your seatbelts!"
"Just like a Saudi Airlines jet — a slight dip for alignment, then full throttle to the skies!"
"Descending slightly, not to fall — but to gather momentum for liftoff!"
"Markets, like planes, don’t take off from mid-air — they need the runway first."
"Runway 102.8 cleared. Destination: 179.8. Ready for takeoff!"
"Don't fear the pullback — it's just taxiing before liftoff."
"From the runway at 102.8, straight up to cruising altitude 179.8 — fasten your trading seatbelts!"

TARGET FILLED ON 1010A trade I gave to my clients the beginning of this month reached the target last week.
These are the kind of the trades we're taking, slow but profitable!
Join the community by following us!

1201 IS ONE OF THE STOKS ON MY WATCHLISTEid Mubarak Said, Now since we're getting back to work sooner, I want to share with you some of the stocks I have on my watchlist.
For 1201, you can buy as soon as the price goes through 9.53 level to target 11.14, and your stop must be at 8.59.
Follow for more!

Morning StarBeautiful Morning Star formation on Weekly basis.
Immediate Resistance is around 33 & then 36.
It should not Break 26.50 now otherwise, we may
witness More Selling Pressure.

HH PrintedIt has taken Support form 23.40 which is
a Very Strong Retracement level.
Immediate Resistance Zone is around 31.90 - 32.50.
If this Level is Crossed, we may witness 34 - 34.20
However, it should touch 40 - 41 in medium term.
Immediate Support levels are 30.30 & then 29.30
which seems to be tested.

Bullish Divergence on Monthly TF.Bullish Divergence on Monthly TF.
Weekly Support seems to be around 30.
& Important Resistance is around 32-33.
Though a re-testing of breakout done. but
Important to Sustain 24.90
As of now, Stock is in sideways movement;
& it will be Bullish once it will cross 36.
A positive point is that there are multiple
bullish / hidden bullish divergences on
different time frames.

Nahdi Medical Co. (4164) - False Breakdown & Trendline Breakout?🚨 Nahdi Medical Co. (4164) recently experienced a false breakdown below 115.6, but has since recovered above it. With the stock now testing a downward trendline, crossing this line could signal the start of a new upward move. 📈
💡 Key Points:
• Current Price: 115.2
• False Breakdown at: 115.6
• Key Resistance at: 118
• Support/Stop Loss: 111.6
• Target: Potential upward swing after breaking 118
📊 Technical Analysis: The false breakdown below 115.6 followed by a recovery signals a potential bullish reversal. If the stock breaks the downward trendline and crosses above 118, it will confirm a new upward swing.
📈 Trade Strategy: The price range between 111.6 and 118 is an ideal buying zone. A breakout above the downward trendline and 118 will confirm the start of a new upward wave. Enter with a stop loss at 111.6, and if 118 is breached, expect the rally to continue.
What are your thoughts on Nahdi Medical Co.’s price action? If you think I missed something or see a different pattern, feel free to share!🔥

SAUDI ARAMCO BASE OIL - Daily Chart (TADAWUL)SAUDI ARAMCO BASE OIL - Daily Chart (TADAWUL)
"After a long bearish phase, the market finally pauses to breathe. If the next bullish leg confirms, it will unlock the roadmap to higher targets. With strong conviction, I believe the 2025 low is already in place. Eyes on 107.4 first, then 111.8. Let price reveal the story.

Trade Idea: ALSAIF STORES (TADAWUL: 4161)📈 Trade Idea: ALSAIF STORES (TADAWUL: 4161)
Timeframe: Daily (1D)
Current Price: 7.96 SAR
Setup Type: Breakout & Retest
🔍 Trade Narrative:
Price has broken above a recent consolidation zone (marked in light blue).
Strong bullish momentum is visible after reclaiming the key level of 7.80.
Market structure shows higher lows and a push towards previous liquidity zones.
🎯 Trade Plan:
Entry Zone: 7.80 – 7.90 (retest area)
Target 1 (T1): 8.35 (Previous High / Liquidity Grab)
Target 2 (T2): 8.44 (Final Target with Heart Marker 💗)
Stop Loss: Below 7.70 (below recent structure)
📊 Risk-to-Reward:
Approx. Risk: 0.20
Reward: 0.44 – 0.64
R:R Ratio: ~2.2 to 3.2
🔧 Confluence:
Daily structure shift confirmed
Liquidity resting above 8.35
Volume spike during breakout
Potential bullish continuation if price retests successfully
