2230| Saudi Chemical Holding CompanySaudi Chemical Holding Company
Bullish
Targets/resistance and support as in the chart
Good luck!

4263| SAL Saudi Logistics Services ComAs predicted flipped 225 to support
Broke 225 (ATH) to a new ATH
236 target from last analysis achieved
Now trading in ascending parallel channel
Next targets: 243 and 252
Good luck!

1212| ASTRAASTRA INDUSTRIAL GROUP
ALL previous targets achieved from previous analysis
Trading in an ascending parallel channels currently at the bottom of it
139 support needs to hold to keep going
Next target mid of the channel at 142 then the top of the channel at 146
Current price (white), goals and resistance (green), and support as in chart (red)
Good luck

1212| ASTRAContinue Bluish
First goal at 129 reached!
Current price (white), goals and resistance (green), and support as in chart (red)
Good luck

4004| Dallah Healthcare CompanyDallah Healthcare Company
Forming cup and handle
Once break 72.5 next target 180 followed by 190.
Good luck!

NATIONAL SHIPPING OF COMPANY OF SAUDI ARABIA IN DALY CHARTHello to all tradingview investors, according to my previous analysis I see a great opportunity with good probability, the details are reflected in the chart, greetings and good luck to al

TANMIYAH Expected to continue uptrend by breaking the first supply zone then to the weekly supply zone above.

ALNAHDI STILL UPThere is a potential to move up to complete the harmonic pattern. The stop loss is penetrating the red line down. So risk to profit ratio is very low.

BATIC INVESTMENTS AND LOGISTMENTS IN DAYLI CHART Hello to all tradingview investors, according to my previous analysis I see a great opportunity with good probability, the details are reflected in the chart, greetings and good luck to al

The potential price action for Al Nahdi 4164 61This could be the potential price movement for AL Nahdi.
We still stage 4 as the way is paved towards high levels
in This stage (4) we have two scenarios
1- To reach 161.6 levels and retreat to lower lows 119
2- to reach 191.4 — motivated by the good news of the Q4 2023 — and start the natural correction to 161 levels for more rises.
All you need is to wait and divide your capital for all scenarios

GULF UNION ALHALIA COPERATIVE INSURANCE IN DAILY CHART Hello to all tradingview investors, according to my previous analysis I see a great opportunity with good probability, the details are reflected in the chart, greetings and good luck to al

4263| SALSAL Saudi Logistics Services
As predicted nicely broke out it's Bullish Pennant!
Now trading between R2 (215) and R3 (225)
It's testing 225 (ATH) if break through next target is 236 SR
Good luck!

1212| Astra Industrial GroupAstra Industrial Group
Bullish
Support at 126
Targets: 129 and 135
Good luck!

1201| Takween Advanced Industries CoTakween Advanced Industries Co
Bullish reversal broke out its Broadening Wedge descending!
Excellent entry!
Levels to watch for:
S1: 17.30, S2: 13.04
R1:20.90, R2: 23.18
Next target 20.90 SR
Good luck!

4072| MBC GROUPMBC GROUP
RSI oversold. SMA 10 days average is below 40 days.
Current target (white), support (red) and resistance (green) levels as shown in chart
I think it gonna continue to downtrend to be between 45 and 50 before we say a reversal
It's a HOLD
Good luck!

ARABIAN DRILLING CO. (2381)The price action is moving in an ascending parallel channel and gives closing at 203 in the last trading session. First support lies in the range of 200-198 and second support around 190-188. If it sustains the support zone then buying opportunities will establish. On the flip side, resistance lies between 214-215, sustaining above can pull the price towards more upward. Close below 180 establish a bearish momentum.

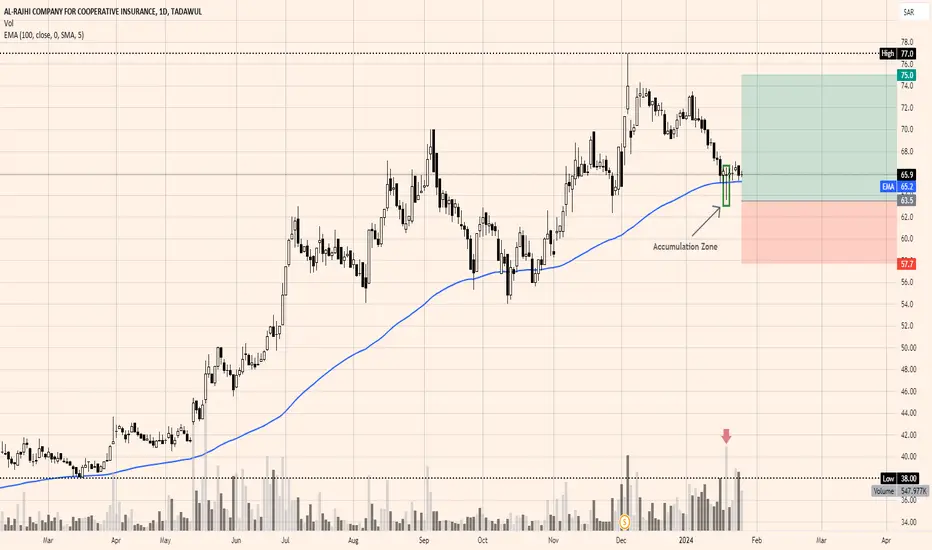
AL-RAJHI COMPANY FOR COOPERATIVE INSURANCE (8230)Rejection occurs after making a high of SR 77 on 5th Dec’ 2023. Currently price is sustaining above 100-day EMA and accumulation in the share with increase in volume of 1.16 million is observed (pointed on chart) on 18th Jan’ 2024 which indicates upward momentum. The stock can be considered in a range of 66-63.50 with the stop loss below 59. On the flip side, resistance lies in the range of 75-77, sustaining above can pull the price more upward.
7010| 7010STC
Next target 46
In the chart:
Green is your next target and resistance
Red is your support
Good luck!

2223 Saudi AramcoThe company is ready to go for 135 from this level then next target will be updated on the chart.


STCThe company is performing exceptionally well in financial terms. Currently, the stock is exhibiting a strong upward trend. My initial target is to reach 44, after which I will provide further updates.
DR SAUD

AL MAWARID MANPOWER IN 4H CHART Hello to all tradingview investors, according to my previous analysis I see a great opportunity with good probability, the details are reflected in the chart, greetings and good luck to al

The Saudi national bank The stock price now stands at important resistance level. What I can see is the tread is upward and the money still in. For me 48 is a just a matter of time.
Dr SAUD
