2200 (APCO) - Near 52-Week High & Potential Breakout SetupArabia Pipes Co. (2200) is currently trading near its 10-year resistance level, indicating a significant price threshold. The stock has been forming higher highs, a bullish trend that suggests an upward momentum.
Interestingly, the stock price is only 1.2% away from its 52-week high, which could indicate a strong market sentiment towards this stock.
The demand volume for this stock is high compared to its supply volume, which could lead to a price increase if this trend continues. Furthermore, the stock is trading above its 20-day moving average, another bullish signal for potential investors.
In terms of financial performance, Arabia Pipes Co. has shown positive year-over-year (YoY) and quarter-over-quarter (QoQ) earnings results, which are all in green. This indicates a healthy and growing company.
The first target price for this stock is 234.6, followed by a second target at 403. This suggests that there is a potential for significant price appreciation in the future. (for mid-term invertors)
For short-term traders/swing traders, the potential take profits levels are marked.
Given these factors, Arabia Pipes Co. could be a good mid-term holding stock compared to short term.
However, as with all investments, it's important to do your own research and consider your own risk tolerance before making a decision. Happy investing! 🙂

Potential Breakout: Saudi Aramco Base Oil Company - Luberef (222Saudi Aramco Base Oil Company - Luberef (2223) is making waves in the market! Trading near its all-time high and above all key moving averages, it’s showing strong signs of an upward trend. High volume activity indicates robust investor interest.
The company has shown rapid earnings growth, up 51% a year for the past five years, indicating a strong future performance. With a first target of 166.8 and a second target of 184.8, it’s a stock to watch! Remember, always do your own analysis before investing.

4140 completed correction and targets 800%.I strongly believe that this stock has completed the correction and will target the hightest top which is around 800% from the current price.
I am in :)

Potential Breakout: Trading Idea for Al Etihaad (7040)"Al Etihaad (7040) is currently in an uptrend and has tested the resistance multiple times. This indicates a strong potential for a breakout soon. The formation of a triangle pattern further supports this possibility. Additionally, the above-average volume suggests increased interest in the stock.
The current price is 172. If the breakout occurs, the first target price could be 192.8, followed by a second target price of 214.2.
However, it’s crucial to monitor the stock closely for any changes in the trend or volume. It’s also important to consider other market factors and news related to Al Etihaad.
Remember, this is just a trading idea based on the current technical analysis. Always do your own research and consider your risk tolerance before making any investment decisions."
Please note that this is not financial advice and it’s important to do your own analysis before making any investment decisions. Investing in the stock market involves risk and it’s possible to lose your investment.

Observation weekThe brice reached to supply zone, and its the same area of the neck line that it broke it down before, the brice at 41.30 made support area before but now its resistant one, now we just need to observe for the current weekly bar if it will maje bearish bin bar ( especially if the brice closes lesser than 41.2) adding to observe stochastic RSI if it will make negative cross especially that it is in overbought zone now.
The first goal is 38.25
The second goal is 36-37
The last goal is 34.7
To know the importance of the 41.3 area, Follow the orange horizontal line

4002Analyzing the current chart, we observe the formation of a Inverted Head and Shoulders pattern. The left shoulder is formed after an initial upward move, followed by a higher peak forming the head. The subsequent pullback creates the right shoulder. The neckline, drawn across the highs of the pattern, acts as a crucial resistance level. A decisive break above this neckline is a bullish signal, indicating a potential trend reversal. Volume analysis reveals a decrease in volume during the pattern formation, with a potential increase on the breakout adding confirmation. Traders often calculate the price target by measuring the distance from the head to the neckline and projecting that upward from the breakout point. As we monitor the price action, it's essential to wait for confirmation and consider risk management strategies.

ABDULLAH AL OTHAIM MARKET IN DAYLI CHART Hello to all tradingview investors, according to my previous analysis I see a great opportunity with good probability, the details are reflected in the chart, greetings and good luck to al


2222Currently aramco is in the selling zone, but if the red average indicated by the blue arrow is broken and we enter the green zone, the market will be in the buying phase.

Will Saudi Cement (3030) cross the resistance and target 61?Weekly chart, Saudi Cement (3030) is trying to complete a chart pattern triangle. After crossing the resistance, the target will be 61.
After crossing the longer-term resistance line (dashed GREY), then the target will be 75, passing through resistance levels 67 and 72
RSI is positive

2200 longArabian pipes lonnnnnnng investment
Now is 114
The key is 139.2
The PT1 403.2
PT2 651.4
The charit is monthly which means that taking a long time as years to reach the PT

4164 longAlnahdi is one of the biggest medical professionals pharmaceutical
Has a golden goal for long term investment

SAUDI REINSURANCE CO. 8200 - Bearish SignsShow some week signs:
1- Monthly resistance at 20.36 which was near a target in previous trade.
2- wait to see in 20 - 20.36 if bearish candle appear.
price will back to these targets
TP1: 18.98
TP2: 200 moving average
if 200ma not hold will not surprise if price to back to 17 or 15

HALWANI BROS. CO. 6001 - Bullish Pullback to 200 Daily MAbullish pullback opportunity towards the 200-day moving average. Several strong indicators support this potential upward movement:
RSI Value Near 50: The Relative Strength Index (RSI) is hovering close to the neutral 50 level, suggesting a balanced market sentiment and potential for upward momentum.
Support Holding at 48.5 Level: The stock has demonstrated resilience by holding a crucial support level at 48.5, indicating buyer interest and a potential bounce.
As the price retraces, there's an opportunity for a second entry around the 48.5 level.
Target Levels:
Take Profit 1 (TP1): 53.2 level or 200 moving average

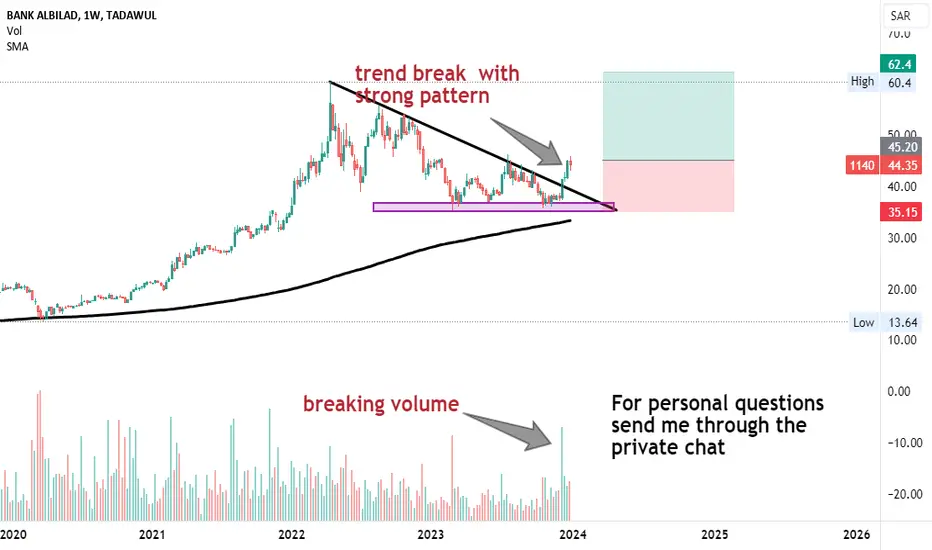
BANK AL BILAD IN WEEKLY CHART .Hello to all tradingview investors, according to my previous analysis I see a great opportunity with good probability, the details are reflected in the chart, greetings and good luck to al
SAUDI ARABIAN AMIANTIT in weekly chart Hello to all tradingview investors, according to my previous analysis I see a great opportunity with good probability, the details are reflected in the chart, greetings and good luck to all

analysis of 1180analysis of 1180 in saudia market
the major trend is uptrend
watch the video and comment us if there is any thing missing


SABIC (2010) will target 102 after crossing resistanceDaily chart, SABIC (2010) stock is trading in an ascending channel for a year.
Now, it is showing positive signals for upwards movement to test the resistance line (BLUE). After crossing (around 86.3), the target will be 96, then 102
Positively, the technical indicator MACD crossed the zero line up.

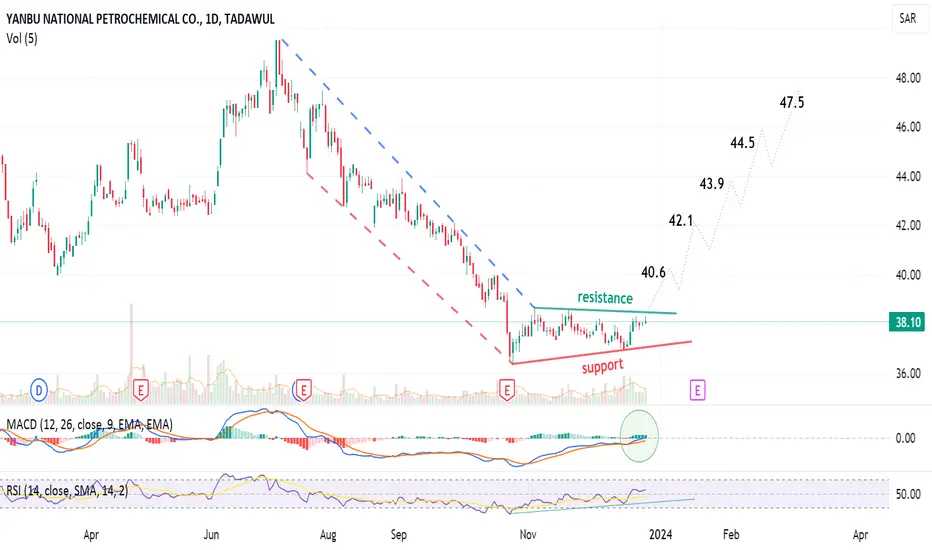
Yanbu Petrochem (2290) to target 47.5 after crossing resistanceDaily chart, the stock is about to cross the resistance up, and then will go bullish to target 47.5, passing through some minor resistance levels as shown on the chart.
Technical indicators:
MACD is about to cross up zero line - positive
RSI is positive
Dr Sulaiman Medical (4013) seems going bullish1-hour chart, the stock is trading in a rising channel.
After crossing resistance blue line (around 305), the target will be 311
Tech. Indicators RSI and MACD are positive
stop loss under support line (red) to be considered

South Province Cement (3050)Monthly chart, the stock is trading in a critical zone, either rebound or fall down.
Probable rebound from support A, then next probability at support B level.
After rebounding the target will be to test the resistance A at around 64.4
Note: rebounding from support C is possible as well. Be careful!
After crossing up 68.5, the next target will be resistance line B at around 81
This is a long term view.

TABUK CEMENT CO Trading below Support Area -Rebound will occurThis company is trading below the support level and one of the beaten up stock.
Recovery will start soon.
RSI,SMA ,STOCH,BB all shows that good upmove will be starting soon.
This is really at good accumulation level .
