1183 SHL Finance - Inverted Head and Shoulder Pattern A technical view on this stock shows that it is within an inverted head and shoulder pattern waiting for a complete formation followed by a retest and then breakout

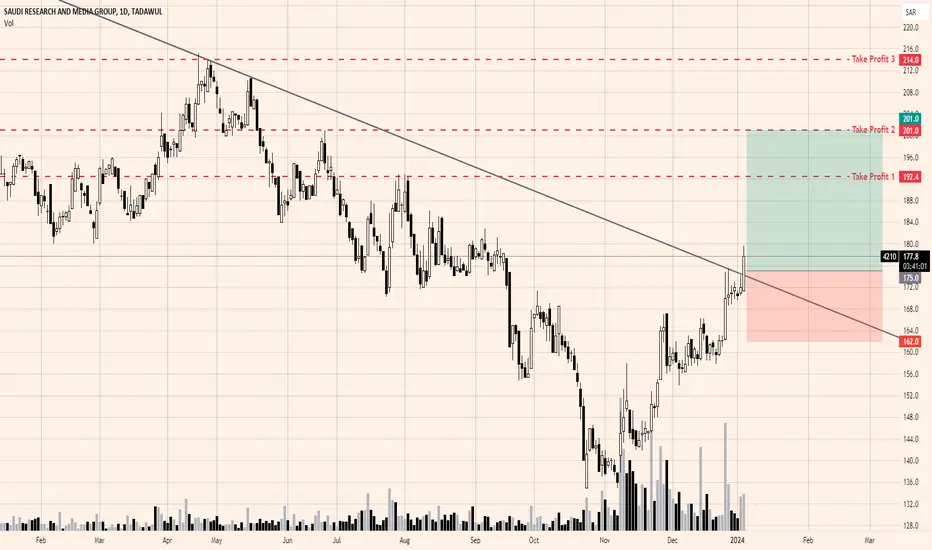
4210Saudi Research and Media group show breakout of trend line in daily time frame. Long position can be consider on the retest of the trend line at 175. First and second targets are 192.4 and 201 respectively. Stop loss below 162.
1211 Maaden, to target 43.2Maaden stock is showing a tendency to cross the channel upwards, supported by the technical. indicators RSI and MACD.
On the daily chart, after crossing 38.4, the target will be 43.2 then 45.1
Stop loss should be considered.

Warming up to the next level Gold is Gold The share is trading closed order block
That order is supported to jump the next level

4040 - SAUDI PUBLIC TRANSPORT CO. LOOKS BULLISHSAUDI PUBLIC TRANSPORT CO. looks bullish and a possible 15% move is expected as per previous price action which was supported by huge volume

8120 - GULF UNION ALAHLIA COOPERATIVE INSURANCE CO.8120 looks bullish as it gave a breakout supported with volume and it is above 200 EMA


2382ADES is ready to archives the target 23.36 in to several days
it's importins don't trade below the 18.32

Rajhi Bank (1120) has a bullish potential to 117.4 and moreWeekly chart, the stock formed a bullish chart pattern falling wedge,
the target is 92.8, then 117.4 passing through the shown resistance levels
Technical indicator MACD is positive and crossed its signal above zero line.

Catering Holding (6004) formed a pattern, to target 181.5Weekly chart, the stock (6004) has formed a bullish chart pattern, and the first target is 143.6
Technical indicators RSI and MACD are positive.
Then Fibonacci extension indicates the following targets 161.4, 171.6, 181.5

ARABIAN PIPESbears are expected to take control for short term with confluence of evidence from divergence

POTENTIAL UPSIDE MOVE IN MIDDLE EAST HEALTHCARE CO. (4009)4009 is making higher highs and higher lows and it has recently broken the all-time high.


Astra Industrial Gr....TadwalAstra industries is in bullish trend...look for consolidation breakout at 1 hr time frame...Bulls can drag the levels to next level...wait for breakout

Jarir (4190) is targeting 16.10 then 17.20 after crossingDaily chart, Jarir stock is about to cross the resistance line (BLUE), then the target will be 17.20
Already a double V bottom formed and the target is 16.10
MACD is very positive, indicating upwards direction.
Stop loss below 14.9 should be considered.

7010 IS CONSOLIDATINGDear Saudi Traders and Investors,
As you can notice on 7010 chart, the market currentlt is in a consolidation area, before you decide if you can buy or sell the market must get out of the area first then you can take your chance.
For further questions don't hesitate to ask!

DON'T BUY 1120 NOWDear Saudi Traders and Investors,
As you have read on the title, don't buy 1120 this week, you can see on the chart, the price is currently on the tough resistance we have at 83.2, since it has a high volume, we must wait for the price to give us a confirmation that it will continue on its way up. If not this MIGHT be a pullback, however there's a high probability of going higher. To play it safe wait for the confirmation.
Don't hesitate to task in case you got furder questions!

DON'T BUY ON 2222Dear Saudi Traders and Investors, it's been a while since I last posted about any market.
Today I'm giving you some updates on Saudi Stocks.
Starting with 2222, as you can see on the daily chart, the price is currently on the tough support level we have at 32.85 with the highest volume we have in the period of the past 2 months. What you got to do now is you wait for the price to come back up with a confirmation of the pullback then you can get in with your position.
Don't hesitate to ask if you got further questions!

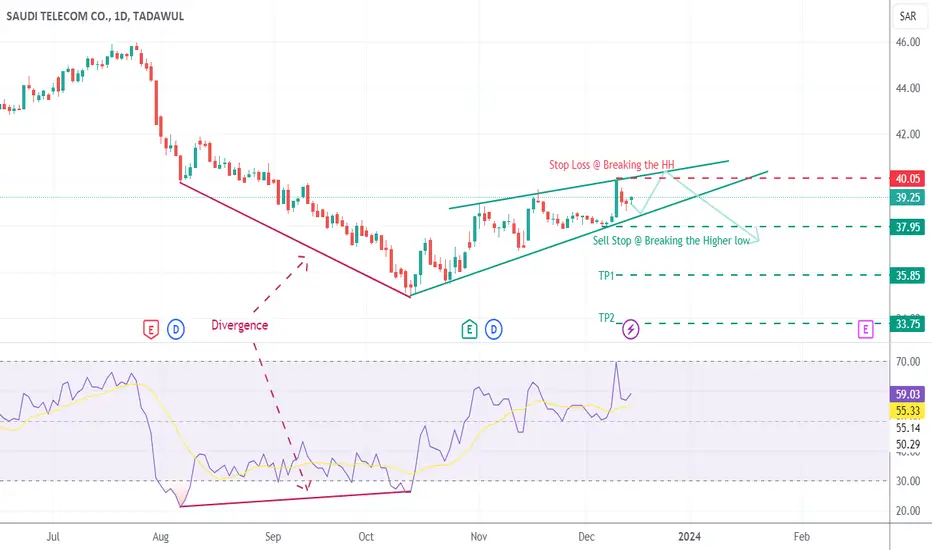
7010 Saudi telecom co. Printing Rising WedgeSTC @ Tadawul printing bearish Rising edge on Daily TF
EP, SL, and TPs marked on Dow Theory
Mouwasat Medical Services Company - 4002The price action is currently retracing towards 0.382 Fib level with support defined around 108.2 - 105.2 range. Long position is considerable at support for the target of previous resistance level of 118 with the stop loss placed below 102.

Arabian Drilling Company - 2381The chart pattern is showing a bearish crab harmonic pattern. Which indicates more downward momentum in its price. It is advised to wait for confirmation for taking a long entry. First and second support levels are 182 and 175 respectively.

4070 First move Getting the First move after recording the 5 y low it semes that they want to fix the way that they work
I see a lond for grat targt it is a good time for going long

1832 to 7.5 I believe the target is to above 7.5 and it is now in the absorption process before moving up. I have no stop loss at this stage. However you need to decide yours.
