TADAWUL: 3050 (Southern Province Cement Co.)📈 TADAWUL: 3050 (Southern Province Cement Co.)
The stock has entered a long-term demand zone near 30.70–32.00, showing historical support. If this zone holds, a potential bullish reversal could take price first toward the 36.90 resistance, then to 44.00, with a final target around 46.35.
Trade Idea:
Entry: 32.00–33.00 (inside demand zone)
TP1: 36.90
TP2: 44.00
TP3: 46.35
SL: Below 29
Bias: Bullish (as long as price holds above 30.70)
Narrative: Accumulation in demand zone with a possible shift in trend.

LeejamA falling wedge is a bullish pattern with the following characteristics:
Shape: Two converging downward-sloping trendlines.
Breakout: Price breaks above the upper trendline.
Volume: Declines during formation, increases on breakout.
Target: Height of the wedge projected from the breakout point.
Stop-loss: Below the most recent swing low inside the wedge.

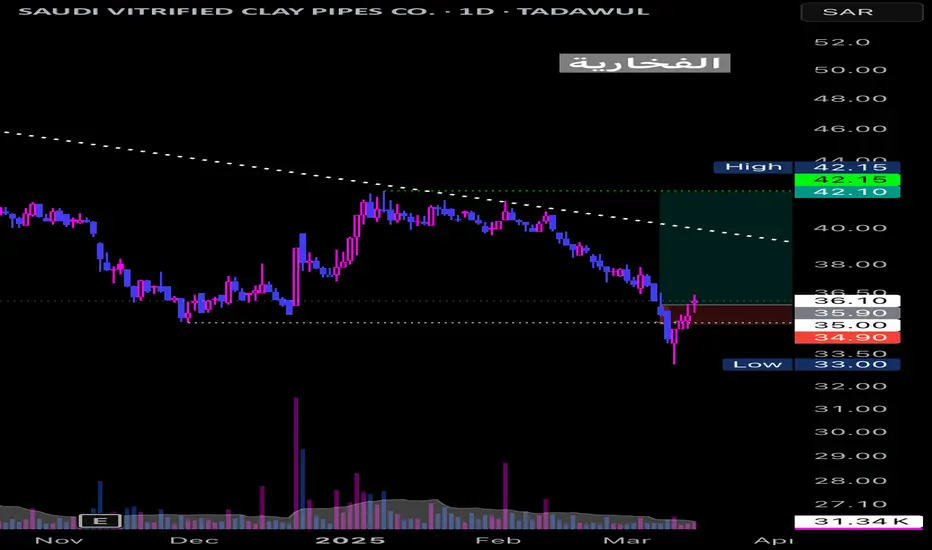
Trading Idea - Saudi Ceramic (2040) | Monthly Chart with Inverte🧠 Trading Idea - Saudi Ceramic (2040) | Monthly Chart with Inverted FVG
🔍 Chart Context:
Price has reacted from a Monthly Inverted Fair Value Gap (IFVG ), indicating a potential premium-level supply zone.
This rejection confirms sellers’ presence at the premium pricing zone, causing a sharp drop.
Price has returned to the discount zone, inside the Monthly FVG (Buy Side Imbalance Sell Side Inefficiency - BISI), offering a potential long opportunity.
📌 Key Technical Concepts:
✅ IFVG = Zone of Previous Supply / Institutional Sell Orders – price rejected sharply from there.
🟦 FVG = Current demand zone (discount area) with potential to support a reversal.
Liquidity above 54.3 SAR remains untouched, showing a magnet for future price movement.
📈 Trade Plan:
Accumulate in the FVG zone (28–30 SAR).
Watch for bullish confirmation (e.g., engulfing candles or internal BOS).
Ride the move towards Buy Side Liquidity @ 54.3 SAR.
🎯 Target Zones:
TP1: 36 SAR (range high retest)
TP2: 48 SAR (pre-IFVG reaction zone)
TP3: 54.3 SAR (BSL target – possible liquidity sweep)
📉 Stop Loss: Below 24 SAR (FVG invalidation zone)
💬 Narrative Summary:
Price was rejected from the Monthly IFVG (supply), now resting in a Monthly FVG (demand). This is a classic Discount → Premium cycle setup, with potential for a bullish reversal targeting Buy Side Liquidity above the recent highs.

4081 Naifat Finance (TADAWUL)📊 Trade Idea Overview – Weekly Timeframe
✅ Key Technical Levels:
Demand Zone: Clearly marked between 12.00 – 13.00, showing strong historical buyer interest.
Current Price: 13.38
Fibonacci Retracement Levels: Price is reacting near the 0.705 - 0.79 zone, which often acts as a bullish reversal area.
Target Price: 18.40 — Identified as Buy-Side Liquidity Zone (BSL) and a previous significant high.
Resistance Zone: Around 18.40, where liquidity is likely to get captured by smart money.
📌 Narrative & Market Context:
Price has shown a bullish reaction from the Demand Zone, indicating accumulation or potential bottom formation.
Fibonacci confluence with demand strengthens the bullish setup.
Once price breaks above 14.00, a bullish market structure shift will be confirmed.
The chart also visualizes a projected path toward 18.40, indicating a strong bullish impulse wave ahead.
📈 Expected Price Path (as shown in chart):
Minor pullback toward 13.00 area (retest demand / Fibonacci zone).
Breakout above 14.00 – a key structural shift.
Bullish continuation toward 18.40 Buy-Side Liquidity.
📍 Trading Plan Suggestion:
Entry Zone: Between 13.00 – 13.20 (ideal demand re-entry).
Stop Loss: Below 12.00 (invalidate demand structure).
Take Profit: 18.40
Risk-Reward Ratio: Excellent (Potentially 1:3+ R:R)

2222 – Saudi Arabian Oil Co | Long Idea – Monthly Chart Analysis📈 2222 – Saudi Arabian Oil Co | Long Idea – Monthly Chart Analysis
Price has reached a Monthly Demand Zone, where strong historical buying interest was seen. After a consistent downtrend, we are now approaching a potential accumulation zone.
🟦 Trade Idea:
Entry Zone: 23.90 – 25.50 (within Monthly Demand)
Stop Loss: Below 22.30 (Monthly swing low)
Target 1: 30.35 (Monthly Fair Value Gap – FVG)
Risk:Reward: Excellent potential with ~17.6% upside
📊 Narrative: This setup aligns with Smart Money Concepts (SMC) and ICT methodology:
Liquidity sweep at the low
Reversal from Demand
Targeting FVG imbalance above
❤️ A potential bullish move is anticipated, tapping into premium pricing around 30.35, which may act as a magnet for price.
🔔 Watch for bullish confirmation candle or a shift in structure (CHoCH) on lower timeframes for refined entry.

2310 ALMOST AT THE PRICE GAPCouple days ago, I posted that 2310 will continue going lower to reach 20.02 before starting to go higher again.
And here is the stock coming lower to our Price Gap to fill it before starting to raise.
Meanwhile, I'm waiting for the stocks I shared to my clients to get a bit far from the entry so they can make profits from them, then I can post them to the public.
Follow for more!

2222 WILL GO LOWER2222 is also one of the stocks that are showing no indication that it will come higher anytime sooner.
We'd expect from the price to drop to 23.90 before reversing, if you're welling to buy I advice you not to.
While waiting for other opportunities, my clients and I are holding on 3 other stocks I will post as soon as the market starts going higher.
Follow for more!

1120 STILL PREPARING TO COME LOWERDays ago, I posted that 1120 will come lower, and still it didn't since it kept consolidating in the LQ we have at 102.2-100.2, we'd expect the price to come at 96.0 for a LQ Grab before continuing going higher.
Meanwhile my clients and I are holding on 3 stocks which I will share to the public as soon as the market goes a bit higher.
Follow for more!

1182 IS STILL GOING LOWER As you can notice on the chart, 1182 is still going in a bearish trend to reach at least 11.36 before it starts creating an entry to take, for now don't buy it since it will continue dropping down.
In few days I will share with you the trades I gave to my clients!
Follow for more!

Bearish Setup on United Electronics Co TADAWUL Weekly TimeframeStructure & Market Behavior:
The market made a strong bullish move from the green highlighted zone labeled as "unmitigated order flow", pushing up with a clear Break of Structure (BoS) on the left side.
A strong rally continued until it peaked (highlighted by the blue dot).
After the peak, the price dropped, creating a Lower High (LH) and Lower Low (LL) structure, suggesting a bearish shift.
Key Elements Marked:
Order Block (OB): A bearish OB is marked on the right side near the current price level (~96.4). This could act as a resistance/supply zone.
Equal Highs (EQ_H): Indicating a liquidity pool where market makers may hunt before a reversal.
Market Pattern: A minor bullish bounce is expected from current levels before a sharp drop.
Forecasted Path:
Price might grab liquidity above EQ_H (false bullish move), then reverse sharply downward.
Target area: Green zone near 40-50 SAR — previously unmitigated order flow/demand zone.
Final projected low is marked around 31.75, which might be an exaggerated worst-case scenario.
Conclusion:
Your chart suggests that the price is in a distribution phase and likely to experience a major sell-off after a liquidity grab above EQ_H. The long-term bearish bias is supported by:
Order block rejection
Equal highs as liquidity targets
Previous bullish rally needing rebalancing (Fair Value Gap / Order Flow)

RIYAD BANK - Weekly Chart (TADAWUL)RIYAD BANK - Weekly Chart (TADAWUL)
Current Price: Around 30.60
Target Price: 42.90 (marked with a heart 💗 at the top)
Plan:
Price may first drop a little (towards 27–28 zone), then move up strongly toward the target (42.90).
Important Zones:
FVG: Areas where price may bounce or react.
OB (Order Block): A strong resistance zone.
Change in Status: A possible support area where the trend might change.
Overall Idea:
The chart shows a possible move down first, then a big upward move toward the 42.90 target.

SAUDI AWWAL BANK | Weekly Timeframe (TADAWUL)Chart Analysis – SAUDI AWWAL BANK | Weekly Timeframe (TADAWUL)
Key Areas Highlighted:
Equal Highs (Buy-Side Liquidity): Marked at the top (around 46.50), indicating a liquidity pool where institutions might target to grab stop-losses above these highs.
Target Price: 42.65 is marked as a significant level where price is expected to move next (short-term target).
FVG (Fair Value Gap - Monthly): A green zone around the 33-36 range indicates an area of imbalance that price might fill before continuing upward.
Market Structure Shift (MSS): Marked on the chart showing a structural change, signaling a bullish reversal.
ITL (Internal Liquidity) & STL (Sell-Side Liquidity): Noted near the lows, highlighting liquidity zones. A note mentions:
“Price will not trade below this low until buy-side liquidity is grabbed.”
Overall Expectation:
Price may retrace into the FVG (Fair Value Gap) zone.
After that, it’s expected to move higher toward the 42.65 level and possibly target the liquidity above equal highs near 46.50.
A projected move of +21.36% is highlighted from current price zone to the 42.65 target.

Gulf Insurance Group - Tadawul (Weekly Timeframe):Trade Idea: Demand Zone Reversal Play
Market Structure: Price has broken the ascending trendline and entered a bearish order block (marked in red). A short-term bearish move is expected.
Expected Move: Price may drop toward the Demand Zone (21.70–23.28) before a potential bullish reversal.
Key Levels:
📉 Support (Demand Zone): 21.70–23.28
📈 Potential Upside Target: 27.00 (first target), continuation possible if momentum builds
Narrative:
After the breakdown from the Order Block and trendline, price is likely to test the strong demand zone.
If the price respects the demand zone, a bullish reversal is anticipated, with the first target around 27.00.
This setup can offer a great buying opportunity with a favorable risk-reward ratio.
💡 Trade Plan Summary:
Wait for bullish price action (confirmation candle) near demand zone
Enter Buy near 23.00–22.00
Target: 27.00+
Stop Loss: Below 21.50 (below demand zone invalidation)

STC Saudi Telecom Weekly chartmotive move 1,2,3,4 and 5 clearly finished
now the market playing A,B and C corrective wave
I draw a zone between 0.618 -0.785 FIB of the motive wave
and compared with measured move
I expect the STC stock price to revers in the zone
good luck trade safe

2360: False Breakdown at Support levels!On the weekly chart, a divergence has formed, while the daily chart shows a false breakdown.

Bearish Divergence on Monthly TF but Bounce ExpectedBearish Divergence on Monthly TF.
Very important Support lies around
160 - 162; and a Bounce is Expected if this level
is Sustained on Monthly Support.
Bullish Divergence on Short TF; so a bounce can be seen
up to 177 & then 194 (if 177 is Sustained)

Fawaz Abdulaziz Al Hokair Co 4240 January 2025Trading Setup Overview
Break of Structure (BOS): A strong move upward has likely broken a key structural resistance level.
Target: Equal highs (liquidity zones) are present above, which might act as magnets for price.
Bias: Keep this idea in view for a short-term bullish continuation unless a reversal pattern forms.

@ Important Support LevelDouble Bottom Formation on Daily TF.
45.50 if Sustained on Weekly basis,
Next Targets can be around 47 initially.
It may test 41.90 - 42 again, prints a
double bottom on Shorter TF & then bounce.
However, 41.50 should not be broken.

Play on Levels124 - 124.50 Very Important Support on Monthly Basis.
Bearish Divergence on Weekly TF that is why it pushed the
price downwards.
Now Hidden Bullish Divergence & Bullish Divergence on Hourly
TF has triggered the price up. Bullish Momentum will resume
once 146 is Crossed & Sustained. Now it is Important to Sustain 134
on Monthly TF & if 165 is Crossed & Sustained, Next Target
can be around 190+
On Daily TF, 134 - 135 is a Resistance. Crossing it will
touch the price around 138-139

6015 IS ABOUT TO GIVE US AN ENTRY TO TAKECouple days ago, I posted that 6015 will come lower to 2.14, if you listened and followed my advice and closed your positions, congrats!
But if you don't and you kept holding, I hope you didn't lose too much of your funds.
For now there's no clear entry to take, we'll keep waiting for the price to give us a proper entry to follow, which I will post a bit late, 2/3d after I share it to my clients so you can see how it goes.
Follow for more!

3092 IS GOING BEARISHWhile searching for some trades for my clients to buy, I found this on RIYADH CEMENT tn which the price is giving a reversal point in which it will go at least to 29.75.
If you're holding any profitable shares, you'd better close and enjoy your profits!
Follow for more!

Bullish on 2382 ADES TASI Fake breakout on 1H and close daily above Monthly level (orange line)
Wait for retest and target 17.18 price level
