BANK ALJAZIRA.Daily analysis.Hello ladies and gentleman,according my analysis To BANK ALJAZIRA STOCK.there is agreat probability long to 19 SAR.

ALMARAI Company Stock.Weekly analysisHello ladies and gentleman,according my analysis To ALMARAI STOCK.there is agreat probability long to 62 SAR.

ABDULMOHSEN ALHOKAIR 1820 - Bullish Signs Show some good signs:
1- First 200 MA retest
2- 2.07 support turn to resistance with good bullish candle
If price continue up
target will be:
TP1: 2.19 level
TP2: Daily 200 MA

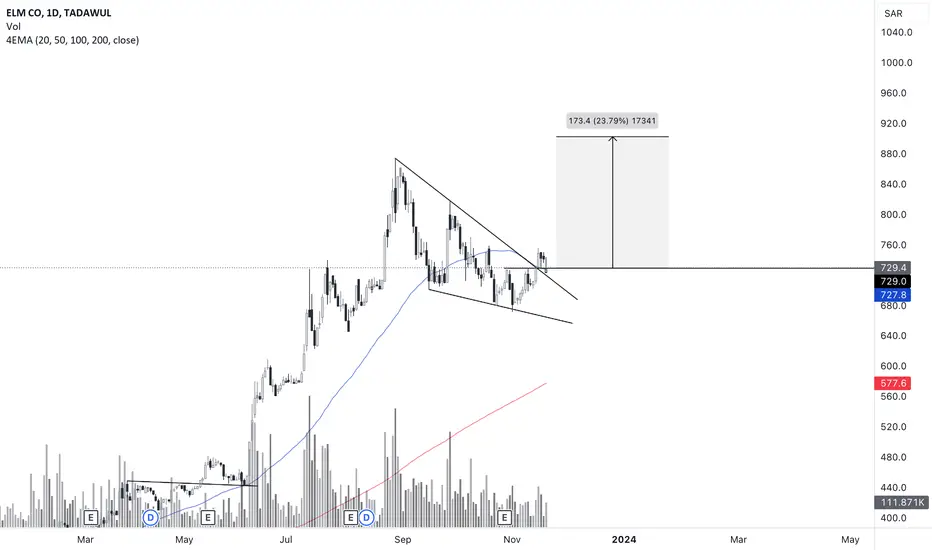
1321 - 6 months RECTANGLE══════════════════════════════
Since 2014, my markets approach is to spot
trading opportunities based solely on the
development of
CLASSICAL CHART PATTERNS
🤝Let’s learn and grow together 🤝
══════════════════════════════
Hello Traders ✌
After a careful consideration I came to the conclusion that:
- it is crucial to be quick in alerting you with all the opportunities I spot and often I don't post a good pattern because I don't have the opportunity to write down a proper didactical comment;
- since my parameters to identify a Classical Pattern and its scenario are very well defined, many of my comments were and would be redundant;
- the information that I think is important is very simple and can easily be understood just by looking at charts;
For these reasons and hoping to give you a better help, I decided to write comments only when something very specific or interesting shows up, otherwise all the information is shown on the chart.
Thank you all for your support
🔎🔎🔎 ALWAYS REMEMBER
"A pattern IS NOT a Pattern until the breakout is completed. Before that moment it is just a bunch of colorful candlesticks on a chart of your watchlist"
═════════════════════════════
⚠ DISCLAIMER ⚠
The content is The Art Of Charting's personal opinion and it is posted purely for educational purpose and therefore it must not be taken as a direct or indirect investing recommendations or advices. Any action taken upon these information is at your own risk.

Saudi Automotive Services CO. 4050Saudi Automotive Services CO. 4050
Trend
Elliott Wave
Chart has language

CITY CEMENT CO. 3003 D1 (SAUDI MARKET)CITY CEMENT CO. 3003 D1
I am using:
Trend
Elliot Wave
Wolfe Wave

Saudi Kayan, to target 14 and 16Saudi Kayan (2350), on the daily chart, I see a forming pattern, going up on a zigzag until 14, then some correction and next target is 16
Quick tradings can be done buy at support / sell at resistance, and so on until reaching the target.
The technical indicators RSI and MACD are supporting this view.
Stop loss at 10.7 should be considered.

HALWANI BROS. CO. 6001 - Bullish Signs Show some good signs:
1- Bullish H&S
2- Retest VAWAP
If price continue up move
target will be:
TP1: 52 level
TP2: Daily 200 MA
TP3: Weekly 200 MA (pink line)

Saudi paper 2300 Technical analysis of stock 2300. Breaking 38 in quantities, the target will be 42 .. It is not a buy or sell recommendation.

4003 United Electronics CO. (Saudi Market - TASI)4003 United Electronics CO. (Saudi Market - TASI)
Elliot Wave and trend
It is not Buy or Sell Recommendation

forecasting CATRION CATERING HOLDING STOCK in dayli chart Hello to all investors, according to my previous studies and according to my experience as a trader, I see a good investment opportunity with a high probability of success, the details are reflected in the graph

High Quality Setup for Saudi Aramco StockTADAWUL:2222 Discount buy opportunity at the determined price
Tight stop , tiny risk , enjoy huge profits .

Falling wedgeFalling wedge in up trend , increase in volume , retest done and moving average 50 support .
Inverse head & shoulder patternThe price recently triggered an Inverse Head and Shoulder chart pattern after breaking through the SAR 135 area, the neckline of this pattern, which is another bullish reversal chart structure. First and second targets are 140 and 144 respectively. Risk is defined below the break of neckline around 133.

4003The current price action exhibits an uptrend, characterized by successive higher highs and higher lows. Notably, when the price touches 200 day SMA, it rebounds upward, establishing new highs. In the recent trading session, the price concluded at 81.1 following a decline of 0.5 SAR. The entry level is identified at 81, with a target set at the previous high that is around 83.50. Risk is defined below 79.50

📈 Technical Analysis of SAUDI AIRLINES (6004) Shares 📊📈 Technical Analysis of SAUDI AIRLINES (6004) Shares 📊
SAUDI AIRLINES (6004) has recently witnessed some interesting developments on the daily timeframe, indicating a potential bull run using the "Smart Money" concept. Let's break it down with some emojis to make it more fun! 🚀💰
1. **Smart Money Concept:** 🧠🤑
The Smart Money concept suggests that institutional investors and experienced traders are making significant moves in the market. These big players often have access to valuable information and can influence stock prices.
2. **Bull Run Indicator:** 🐃📈
Several technical indicators may hint at the start of a bull run:
- **Moving Averages:** 📉➡️📈
The stock's moving averages (e.g., 50-day and 200-day) have crossed over or are diverging, which is a bullish signal. This indicates growing upward momentum.
- **Volume Increase:** 📊📈
Increased trading volume suggests growing interest and participation in the stock, a classic sign of a potential bull run.
- **MACD Indicator:** ⚙️📈
The Moving Average Convergence Divergence (MACD) is showing a bullish crossover, further indicating potential upward movement.
- **RSI:** 📊📈
The Relative Strength Index (RSI) is trending upwards and is not yet overbought, implying room for further price appreciation.
3. **Candlestick Patterns:** 🕯️📊
Look for bullish candlestick patterns such as hammer, engulfing, or morning star patterns to confirm the bullish sentiment.
4. **Support and Resistance:** 📈🔒
Identify key support and resistance levels. A successful break of resistance can be a strong signal of a bullish trend.
5. **Fundamental Analysis:** 📰📈
Keep an eye on any fundamental developments or news related to SAUDI AIRLINES. Positive news can further support the bullish case.
6. **Risk Management:** 🛡️💡
It's crucial to manage your risk properly. Use stop-loss orders to protect your investments, and never invest more than you can afford to lose.
Remember, while these indicators and concepts can be helpful, no analysis is foolproof. It's essential to do your research, consider the broader market context, and consult with a financial advisor if needed.
Happy trading! 📈🤑🚀 #StockAnalysis #BullishTrend

4040 is expected to cross 17.4, target 19.6Saudi Public Transport Co.
On the daily chart, the tech. indicators are showing tendency to cross 17.4 up (the resistance line), then the target will be 19.6
Stop loss 16.8 - 16.5
On the weekly time frame, above 18.5, the far target will be 35.7

8010 consolidate stateThe current market exhibits a consolidation phase, with support at 114 and resistance at 128. The recent close at 119 aligns with the 50-day SMA. The pattern indicates potential upward momentum if the price maintains support, with a target around 125. Monitoring the price's ability to sustain support is crucial for anticipating the projected upward movement.

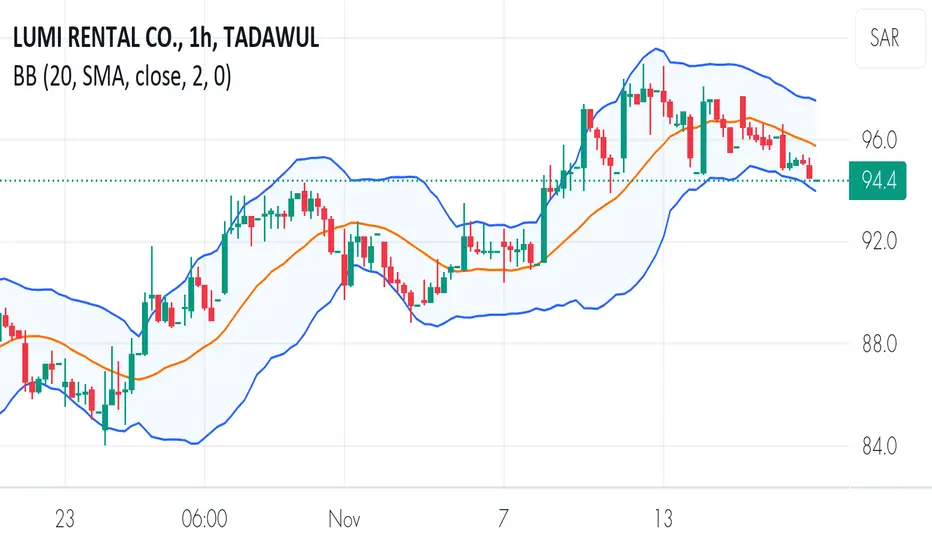
4262 upside continuesThe current price action exhibits an uptrend, characterized by successive higher highs and higher lows. Notably, when the price touches the lower Bollinger band, it rebounds upward, establishing new highs. In the recent trading session, the price concluded at 94.40 following a decline of 1.7 SAR. The entry level is identified at 94, contingent upon the support of the lower Bollinger band, with a target set at the upper band level of 97.50.

2090 -Tadawul - Possible setup.breakout of trend line, buy at current price with the stop loss of 19.35, and Take profit is 24.50.

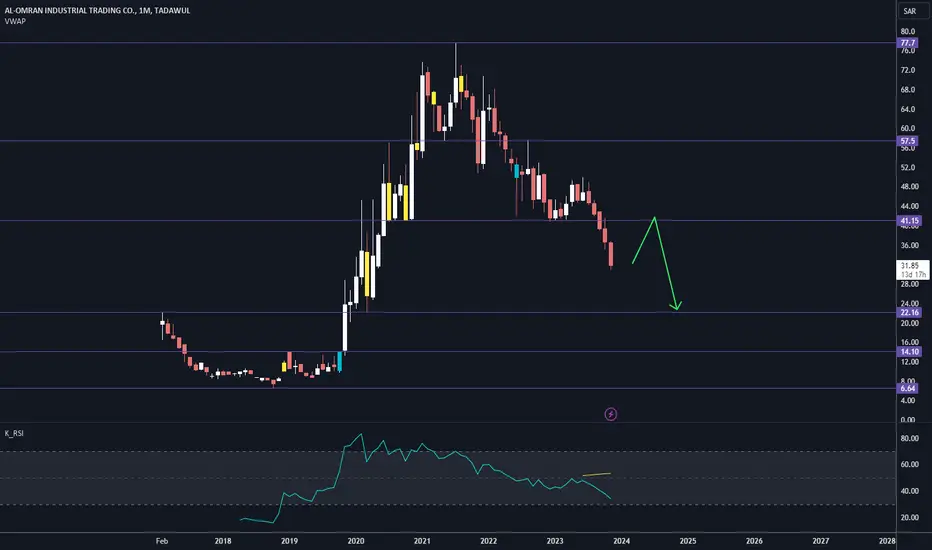
AL-OMRAN INDUSTRIAL TRADING CO. - Bearish Signs Show some weak signs:
1- Strong down move
2- Break strong support
If support turn to resistance
target will be:
TP1: 22 level
Lumi break the pattern Hello everyone…
Please refer to last video I made about lumi and potential targets.
Best of luck
