1810 Seera GroupHello traders,
I'm looking for opportunity to re-enter this stock this week.
It's clear it target 26.8
Good Luck for all

8280 LivaHello traders,
I'm looking for opportunity to re-enter this stock.
this week I will stary buying it.
Good Luck for all

#3090 #Tabuk CementBased on the pattern identified on the weekly chart, a bullish flag pattern is currently forming. This suggests a continuation of the previous upward trend. Given the characteristics of the pattern, we can plan entries on a medium to long-term timeframe by closely monitoring the identified levels on the chart. Entries only a breakout.
"Non financial advice, do your own research"

at Resistance Zone but Bullish..Currently at an Important Resistance zone.
Once this Resistance is Broken, we may witness 170+

Stock is in Uptrend.Stock is in Uptrend.
0.382 fib retracement done around 36-37.
Crossing & Sustaining 49 may lead it towards 54 - 55.
Current level may act as Support.
However, Bearish Divergence is there, so better to
wait for Crossing 49.
Rectangular Box + Previous HL is around 32.80 - 33
that should not break in any case, otherwise
Trend Reversal is Possible.

SAUDI ARAMCO is BullishPrice was in a strong downtrend, however it seems that bears are exhausted and price is ready for a take-off from here. Bullish RSI divergence has emerged on both daily and weekly time frame, hinting the control of bulls. If previous lower high is broken successfully, then we can expect a bullish reversal as per Dow theory. Targets are mentioned on the chart.

Elm (TADAWUL: 7203) – Key Gann Levels in Play!Elm has been on a rollercoaster ride, experiencing a strong uptrend before hitting resistance and pulling back. The stock is now trading around 1,059 SAR, testing a key 360° Gann level at 1,015 SAR. So, what’s next? Let’s dive in!
Could be the scenario ;)
🔍 Technical Breakdown:
🔹 Resistance Levels:
1,181 SAR (405° Gann level) – A key zone that previously acted as resistance.
1,359 SAR (450° Gann level) – Breaking above this could restart the bullish trend.
🔹 Support Zones:
1,015 SAR (360° Gann level) – Crucial support currently being tested. A hold here could trigger a bounce.
862 SAR (315° Gann level) – Next potential support if selling pressure continues.
🔹 Trend Analysis:
The stock had a massive bull run before topping out and now seems to be in a correction phase.
If bulls defend 1,015 SAR, we might see another upside attempt.
🎯 Potential Scenarios:
🟢 Bullish Case:
Holding 1,015 SAR could lead to a retest of 1,181 SAR and, if momentum continues, a push towards 1,359 SAR.
🔴 Bearish Case:
A break below 1,015 SAR could signal further downside towards 862 SAR and possibly lower.
⚠️ Key Takeaway:
Elm is at a make-or-break level! Will bulls step in at 1,015 SAR, or is more downside ahead?
💬 What’s your outlook? Share your thoughts in the comments! 🔽🔥
#Elm #TADAWUL #StockMarket #GannAnalysis #TechnicalAnalysis

Saudi Arabian Amiantit Co (2160) - Trade Idea📌 Saudi Arabian Amiantit Co (2160) - Trade Idea
📊 Market Behavior:
Price always follows one of two paths:
1️⃣ Offering Fair Value – Where price stabilizes and attracts buyers/sellers at a justified level.
2️⃣ Seeking Liquidity – Where price hunts stop losses, liquidates positions, and manipulates emotions.
🔥 Current Phase:
Right now, the market is in a liquidity-seeking phase 🏃♂️💨, where it is:
✅ Shaking out weak hands (retail traders getting stopped out).
✅ Creating a manipulation leg (to trap traders before a reversal).
✅ Grabbing liquidity from key levels (before moving towards fair value).
🎯 Main Target:
🚀 The Yearly Fair Value Gap (FVG) is the ultimate target, where price is likely to rebalance and provide high-probability trading opportunities.
⚠️ Key Takeaways:
🔹 Expect volatility – market makers are engineering liquidity.
🔹 Stay patient, avoid emotional reactions.
🔹 Smart money moves in phases – follow the narrative.
💡 Execution Plan: Wait for confirmation before entry, align with smart money, and target high-probability zones! 🎯🔥
📈 Trade Smart, Stay Ahead! 💎🚀

DONT BUY 2310Last month I posted not to buy on 2310, I explained why you shoudn't. Some people did buy and now they're in a loss.
You still can't buy since the market just pulled back on the liquidity zone again and continued going lower and lower.
Follow for more!

2222 IS STILL GOING BEARISHA month ago I posted not to buy 2222, again as always prople keep arguing and buy, and at the end they come back to you and ask about what to do.
Well, as you can notice on the chart, we have the price coming down to our liquidity zone to start manipulating and playing before continuing its way going lower and lower.
Now what you're going to do is to stay put and wait for the next move the market is going to do.
Follow for more!

NOT A GREAT TIME TO BUY 1120A month ago, I posted to close 1120 at 100.2 in case you're a buyer, some of you did indeed listen, some others managed to text me and argue about what I posted, and now you got the proof of what I was saying.
Now you'll wait for the price to come down to l96.0, there we can decide how the market will be going.
For now if you're still holding just close your position, and if you're willing to buy just DONT!
Follow for more!

Different PatternsRecently made HH HL on Bigger TF.
Breakout Re-test possible around 21.50 - 22
Otherwise, Trendline Support around 24.80 - 26
Upside Targets can be around 28.50 - 29 & then 31+

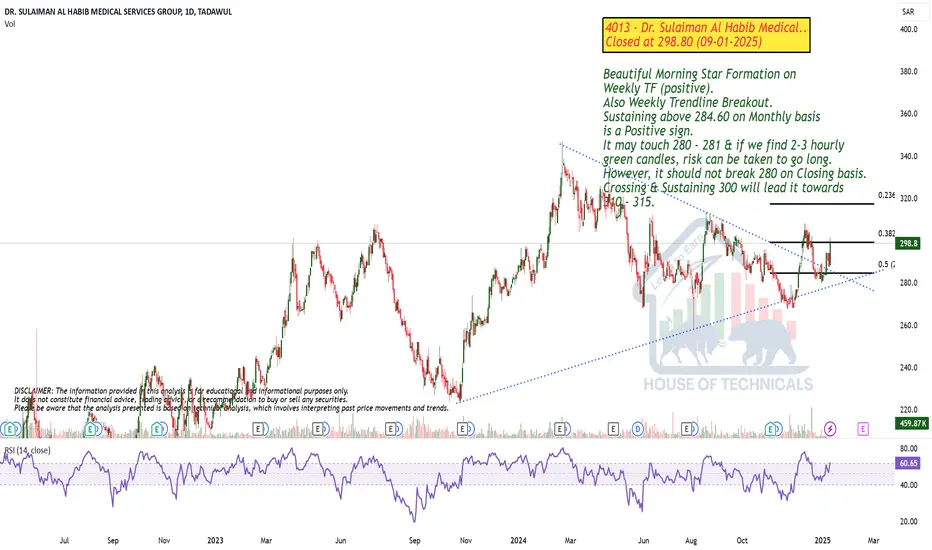
Beautiful Morning Star Beautiful Morning Star Formation on
Weekly TF (positive).
Also Weekly Trendline Breakout.
Sustaining above 284.60 on Monthly basis
is a Positive sign.
It may touch 280 - 281 & if we find 2-3 hourly
green candles, risk can be taken to go long.
However, it should not break 280 on Closing basis.
Crossing & Sustaining 300 will lead it towards
310 - 315.
NAHDI MEDICAL CO. is BullishPrice was in a declining phase, and respecting a descending a trendline, however a double bottom pattern with bullish divergence emerged on daily time frame, hinting the return bulls. If the trendline and previous lower high are broken successfully, then we can expect a bullish reversal as per Dow theory. Targets are mentioned on the chart.

saudi cablesintersting chart after long term of consolodition
which can not be explained easier than this

Important Resistance around 19.50Bullish on Daily TF.
ABCD Pattern will be in
play once it crosses & sustains 19.50.
Potential to touch 24 then.

Gann Analysis for NATIONAL AGRICULTURAL DEVELOPMENT Co. (TADAWUL1️⃣ Key Gann Levels Identified
The Gann levels shown in the chart act as support and resistance zones, where price movement often reacts. Below are the key levels:
Degree Price Level (SAR) Significance
720° 41.654 Major Resistance
630° 35.45 Strong Resistance
540° 29.746 Medium Resistance
450° 24.542 Current Level - Pivot Point
360° 19.838 Key Support
270° 15.634 Medium Support
180° 11.93 Strong Support
90° 8.726 Major Support
0° 6.022 Long-Term Base
2️⃣ Market Structure Analysis
✅ Recent Price Action:
The stock previously rallied strongly to 630° (35.45 SAR) but failed to sustain above it.
It has now retraced to 450° (24.542 SAR), which is a critical pivot level.
Price is trading near a support zone, making this an important level to watch.
3️⃣ Possible Future Scenarios
📈 Bullish Scenario (Price Moves Up)
🔹 If price holds above 450° (24.542 SAR) and forms a bullish structure:
✅ First target = 540° (29.746 SAR)
✅ Next target = 630° (35.45 SAR)
✅ Final bullish target = 720° (41.654 SAR)
🎯 Confirmation for bullish move:
Price closing above 540° (29.746 SAR) with strong volume.
RSI/MACD showing bullish divergence.
📉 Bearish Scenario (Price Drops)
🔻 If price breaks below 450° (24.542 SAR):
❌ Next support = 360° (19.838 SAR)
❌ Deeper support = 270° (15.634 SAR)
❌ Final major support = 180° (11.93 SAR)
⚠️ Warning Signs for a Bearish Move:
Weekly candle closes below 450° (24.542 SAR) with high volume.
Momentum indicators (RSI/MACD) turn negative.
4️⃣ Recommended Trading Strategy
✅ Long (Buy) Setup:
Buy near 450° (24.542 SAR) with stop-loss at 23.50 SAR.
Target = 540° (29.746 SAR) → 630° (35.45 SAR)
❌ Short (Sell) Setup:
If price breaks below 450°, short with target at 360° (19.838 SAR).
Stop-loss = 26 SAR (above recent highs).
Final Notes
⭐ 450° (24.542 SAR) is a key decision point.
⭐ Holding above it = bullish; breaking below it = bearish continuation.
⭐ Monitor price action & volume for confirmation.
you can request analysis for any stock
just write in comments,
wish you best of luck!

National Industrialization Company SJSC (2060)Hello traders,
It's time to be looking for industrial stocks.
technically it targets 10.6 and 11.6
Good Luck for you all

Nahdi Medical (4164) Tadawul: Double-Bottom FormationThe chart shows forming a potential double bottom, a neckline (potential breakout level) appears around 123.20 SAR. A decisive break above this resistance is generally seen as the bullish trigger which could open 6–7% profit opportunity toward ~131.8 SAR Always manage risk in case the breakout stalls.

Al Hammadi_4007_Tadawul: Bullish Momentum
Al Hammadi_4007_Tadawul: Price has rebounded near the 200 SMA <~43 SAR> and is hovering around the 100 SMA, sustained closes above these long-term averages typically indicate bullish strength.
Support & Resistance: Primary Support ~37–38 SAR, which held during the recent pullback.
Momentum: Signaling a potential shift in bullish momentum, safest entry can be taken later at a breakout of B-Point to have 25~26% potential profits
Fundamental Highlights
Earnings Growth: Net income has shown consistent year-over-year increases, indicating improving profitability.
Cash Flow Trend: Positive and rising cash flow strengthens the company’s financial position, providing flexibility for future investments or debt reduction.
TTM Growth: Trailing twelve-month figures reflect ongoing momentum, suggesting recent quarters have trended positively.
Forward Outlook: With Q4 earnings expected soon and an overall 2024 forecast above 2023 levels, fundamentals appear aligned for continued growth.

BAWANacording to my previous technical studies,i see a great opportunity with high probability of succes,the details are reflected in tge chart,good luck to all

AL JOUF CEMENT acording to my previous technical studies,i see a great opportunity with high probability of succes,the details are reflected in tge chart,good luck to all

YANBU CEMENT acording to my previous technical studies,i see a great opportunity with high probability of succes,the details are reflected in tge chart,good luck to all
