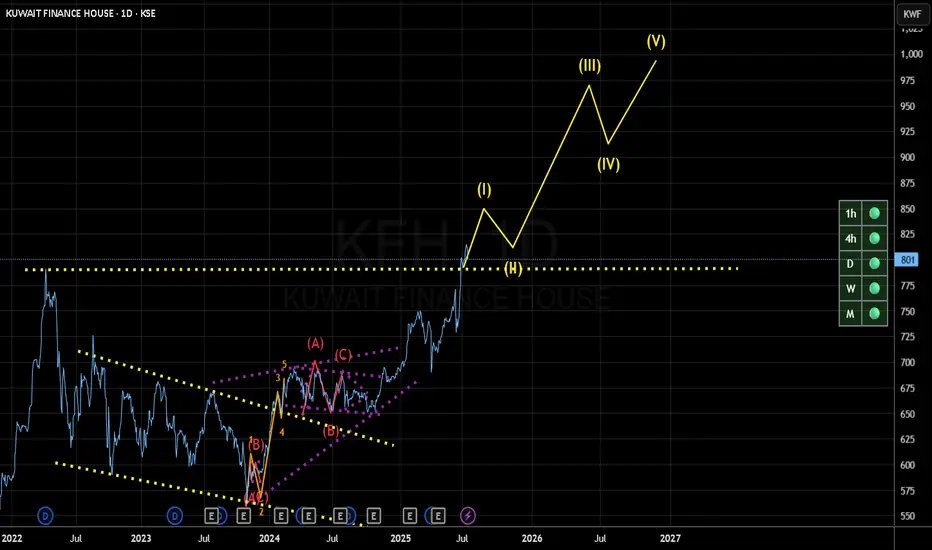
update kfhI believe now according to Elliott waves the first wave is forming and it is the start of large upward waves

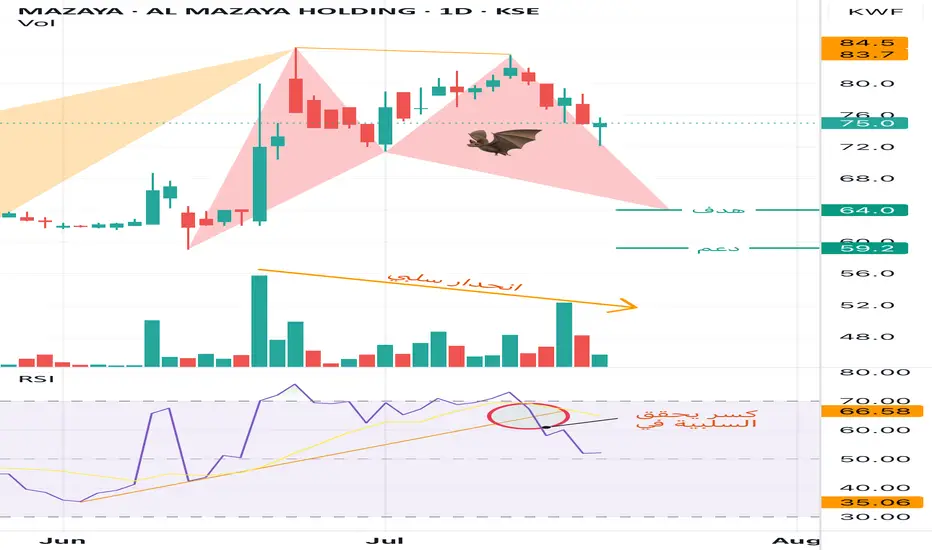
Al Mazaya Holding (MAZAYA) – Daily ChartAl Mazaya has entered a confirmed bearish phase, supported by multiple technical signals. The current setup suggests a continuation of the downside movement, with two key downside targets in play.
Key Technical Signals:
1. Bearish Harmonic Pattern – Bat Formation:
• The chart has formed a harmonic Bat pattern, which typically precedes a price decline.
• The pattern’s projected target is 64.0 KWF, with a further potential move toward 59.2 KWF, acting as a second-line support if the initial support near 63.0 KWF fails.
2. RSI Breakdown:
• The Relative Strength Index (RSI) has broken below its rising trendline and the moving average, confirming loss of momentum.
• This breakdown is a strong bearish signal, indicating weakening demand and increasing selling pressure.
3. Volume Decline – Negative Divergence:
• A clear volume divergence is visible, with trading volumes declining despite previous price rallies.
• This indicates distribution behavior, where smart money may be exiting positions, adding to the bearish bias.
Support and Resistance Levels:
• Current Price: 75.0 KWF
• First Support / Bat Target: 64.0 KWF
• Second Support: 59.2 KWF
• Resistance Range: 83.7 – 84.5 KWF (previous swing high)
Conclusion:
The technical structure for Al Mazaya Holding has shifted to bearish. The breakdown in RSI, the completion of the Bearish Bat pattern, and the diminishing volume all reinforce the possibility of a price decline toward 64.0 KWF, and potentially to 59.2 KWF if downward momentum continues. Investors should exercise caution and closely monitor support levels for any reversal signs.
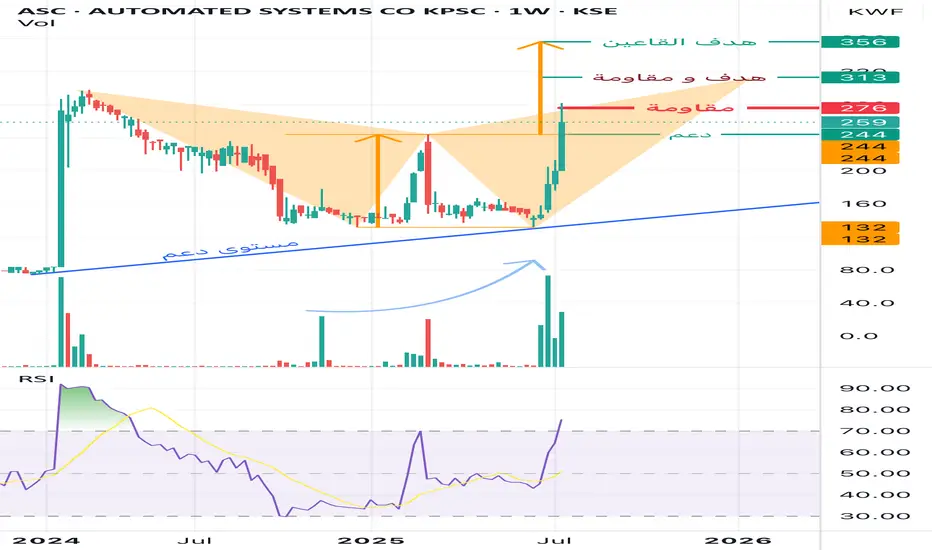
Automated Systems Co. (ASC) – Weekly ChartThe stock has successfully reached the initial target as per the previous analysis. Upon re-evaluation, further bullish potential is evident, but key resistance levels may interrupt immediate upside continuation.
1. Resistance and Potential Retracement:
• The stock is currently facing a strong resistance at 276 KWF, which has temporarily capped the current rally.
• A pullback to the 244 KWF support level is possible, serving as a healthy retest before any renewed breakout attempt.
2. Harmonic Pattern – Shark 🦈:
• The current structure aligns with a Shark harmonic pattern, projecting a target at 313 KWF, which also coincides with a major resistance level.
• Due to this confluence, the 313 level serves both as a target and a barrier, making it a critical decision point for bulls and institutional players.
3. Double Bottom Formation (Pattern Analysis):
• A symmetrical double bottom pattern is visible, suggesting a more extended bullish outlook.
• This pattern projects a potential longer-term target at 356 KWF, which could be the area where smart money (market makers) aim to unload positions.
4. Volume and Momentum:
• Volume has shown a noticeable increase, reflecting growing market interest and accumulation.
• The RSI indicator has surged sharply but is approaching overbought territory, indicating momentum is strong, though some cooling may occur.
Consclusion
• The stock remains in a bullish structure, but is currently testing a key resistance level.
• A pullback to 244 would be technically constructive if followed by a breakout above 276.
• If 276 is breached decisively, the next objectives would be:
• Target 1 / Resistance: 313 KWF (Shark pattern)
• Target 2: 356 KWF (Double Bottom pattern)
Recommendation:
Monitor price behavior around 276. A successful breakout with volume confirmation opens the way toward 313 and beyond. A pullback to 244 can be considered a strategic re-entry opportunity within the broader bullish framework.
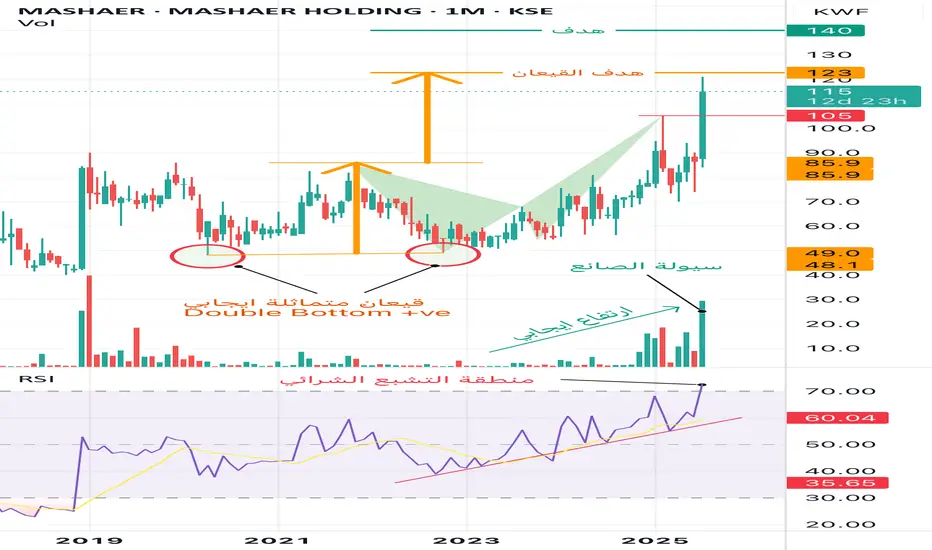
Mashaer Holding – Monthly ChartThe stock maintains a clear upward trend, with no current negative technical signals. This suggests a high probability of continued price appreciation toward higher target levels.
Detailed Analysis:
1. Chart Pattern – Double Bottom:
• A positive symmetrical double bottom has been completed, which is one of the strongest bullish reversal patterns.
• The measured target from the pattern (based on the neckline breakout) projects a price level of 123 KWF.
• The current price is 115 KWF, indicating more room for upside.
2. Volume and Liquidity:
• A noticeable surge in trading volume during the latest monthly candle reflects strong institutional inflow.
• This increase is often referred to as “smart money” activity, suggesting accumulation by major players.
3. RSI – Relative Strength Index:
• The RSI has moved into the overbought territory (above 70), signaling that the stock is potentially overextended in the short term.
• However, there are no signs of bearish divergence or a clear reversal signal yet.
• The RSI trend has been consistently rising for several months, supporting the ongoing bullish momentum.
Summary:
The stock remains technically bullish, supported by a valid breakout pattern, rising volume, and strong momentum indicators. Despite the RSI entering overbought levels, the lack of any confirmed reversal signal means the uptrend remains intact.
Price Targets:
• Pattern Target (Double Bottom): 123 KWF
• Strategic Resistance / Long-Term Target: 140 KWF
KFH BAITEK UPDATE lliott Wave Patterns, based on the 39.9 cycle and the 69.3 cycle, are a correction until tomorrow, and the next few weeks will be an upward trend.
burgan companyacording to my previous technical studies,i see a great opportunity with high probability of succes,the details are reflected in tge chart,good luck to all

MEZZAN HOLDINGacording to my previous technical studies,i see a great opportunity with high probability of succes,the details are reflected in tge chart,good luck to all

beyout investment groupeacording to my previous technical studies,i see a great opportunity with high probability of succes,the details are reflected in tge chart,good luck to all

MOBILE TELECOMUNICATIONSacording to my previous technical studies,i see a great opportunity with high probability of succes,the details are reflected in tge chart,good luck to all

ALI ALGHANEM SONS AUTOMOTIVEacording to my previous technical studies,i see a great opportunity with high probability of succes,the details are reflected in tge chart,good luck to all

MUNSHAAAT REAL ESTATE PROJECTacording to my previous technical studies,i see a great opportunity with high probability of succes,the details are reflected in tge chart,good luck to all

MOBILE TELECOMUNICATIONacording to my previous technical studies,i see a great opportunity with high probability of succes,the details are reflected in tge chart,good luck to all

BURG: Buy ideaBuy idea on BURG as you can see on the chart because we have the breakout with force the resistance line by a big green candle follow by a large green volume.

GBK: Sell ideaOn GBK we are in a bullish channel situation with a succession of many green candles accompanied by many green volumes.
Furthermore, this configuration of the chart indicates a high probability of having a bearish trend over a time unit of four (04) hours.
But this drop will only be confirmed by the break of the support line and the vwap as you can see on the chart.

KCEMKUWAIT BOURSA STOCK
I think it is ready to go and if we have any draw back it only temporary consider the entry point and stoploss

ARZAN FINANCIAL GROUPacording to my previous technical studies,i see a great opportunity with high probability of succes,the details are reflected in tge chart,good luck to all

IFAI think the stock complete five Elliot-Wave .. now time to corrective wave take it to down then will start new and strong wave..
will take time to reach the box bcz analysis based on weekly timeframe
اعتقد انه اكتمل خمس موجات صعودية والحين وقت التصحيح الى الصندوق اذا الله كتب بعدها بنشوف له صعود قوي ...
يحتاج وقت للوصول الى الصندوق..
كل التوفيق
This Is Not Financial Advice.

KUWAIT REAL ESTATEHello to all tradingview investors, according to my previous analysis I see a great opportunity with good probability, the details are reflected in the chart, greetings and good luck to al

AL EID FOODHello to all tradingview investors, according to my previous analysis I see a great opportunity with good probability, the details are reflected in the chart, greetings and good luck to al

HEAVY ENGINEERING INDUSTRIES AND SHIPBUILDINGHello to all tradingview investors, according to my previous analysis I see a great opportunity with good probability, the details are reflected in the chart, greetings and good luck to al

Kuwait project holdings (KPROJ)This trade is a high quality trade I will remind you about it . I do not know about if it Halal or not DO YOU RESEARCH

AL IMTIAZ INVESTMENT GROUPHello to all tradingview investors, according to my previous analysis I see a great opportunity with good probability, the details are reflected in the chart, greetings and good luck to al

SPECIALITIE GROUP HOLDING IN DAYLI Hello to all tradingview investors, according to my previous analysis I see a great opportunity with good probability, the details are reflected in the chart, greetings and good luck to al
