Case Study - Bursa - QL Resources BhdCase Study - Bursa - QL Resources Bhd
Fundamental and Historical Analysis:
Business Diversification:
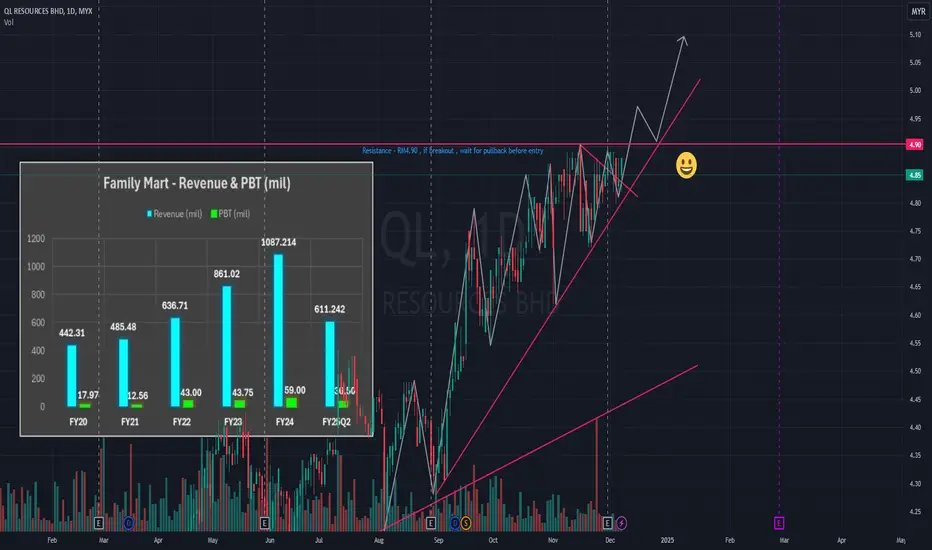
Starting as an agribusiness and fisheries company, QL has expanded into the food, retail (FamilyMart), and green energy sectors.
The introduction of FamilyMart in 2016 was a pivotal move, strengthening QL’s presence in the retail and fast-food sectors, making it a key revenue source alongside agribusiness.
Green Energy:
The renewable energy initiative highlights QL’s commitment to sustainable development, making it appealing to ESG (Environment, Social, Governance) investors.
Stable Profitability:
Financial data indicates overall revenue growth, but profit margins (PBT) require attention, especially in FY24 and FY25 Q2.
Key Challenges:
Declining margins in FY25 Q2 and the need to compete in a highly competitive retail market may challenge future performance.
Technical Analysis Based on the Chart:
Main Trend:
The chart indicates a strong upward trend with consistent support lines, signaling investor confidence in QL shares.
Critical Levels:
Major Resistance: RM4.90 – this is a key level that needs to be breached to confirm upward momentum.
Major Support: Uptrend line – a breakdown below this trendline could indicate a reversal in momentum.
Zig-Zag Pattern:
The price correction in a zig-zag pattern is healthy and suggests consolidation before the next significant move.
Trading Strategy:
Wait for a breakout above RM4.90 with high volume as a sign of buyer strength.
Ensure a stop-loss plan below the support trendline to manage risk.
Insights and Recommendations:
Long-Term Growth Potential:
Diversification into green energy and FamilyMart's dominance in the local market provides positive growth prospects.
Risks:
Declining profit margins in future financial reports should be monitored.
If competition in the retail sector intensifies, QL will need to enhance operational efficiency to maintain profitability.
Smart Investment Steps:
Short-Term Investors: Focus on the RM4.90 level and use a "pullback entry" after a breakout.
Long-Term Investors: Focus on the company’s fundamentals, particularly developments in green energy and FamilyMart expansion.
KSL Buy at 1.73KSL a strong developer at Johor. Johor property market in up trend. Annual profit margin and revenue increasing. PE at 3.99. Buy if drop below support line prices 1.73.

BIMB Short Selling at 2.67It will fall below 2.63. Profit fall for 3 conservative years. PE at 10.34. Volume drop indicated.


EG INDUSTRIES - POTENTIAL BULLISH CONTINUATION PATTERN ?EG INDUSTRIES - CURRENT PRICE : RM2.03
In long term the stock is UPTREND as the share price is above 200-day EMA. For short and medium term, the stock is trading in sideways. However, based on chart pattern analysis, the stock is potential of making BULLISH ASCENDING TRIANGLE - Bullish Continuation Pattern .
Based on ICHIMOKU CLOUD, the share price is trading above CLOUD indicates a little bit bullish scenario. CHIKOU SPAN is in CLOUD and pending to breakout above cloud. If CHIKOU SPAN manage to break above CLOUD, it will add more bullish outlook for the stock and technically it is a buy signal.
At current moment, if the stock made a high above RM2.05, then technically it is a buy signal for me based on CHART PATTERN (Completion of ASCENDING TRIANGLE) and ICHIMOKU CLOUD (CHIKOU SPAN breakout CLOUD).
ENTRY PRICE : RM2.06 - RM2.10
TARGET PRICE : RM2.22 and RM2.37
SUPPORT : 50-day EMA

WPRTWPRTOur algorithm has identified potential upward signals in the current market. Increased trading volume and prices above the EMA20 and EMA50 suggest a possible upward trend.
💡Trading idea dan plan:
✅Entry: 4.43
🛑Stop Loss @SL: 4.10
🎯Target Price @TP1: 4.75
🎯Target Price @TP2: 5.08
🎉Target Price @TP3: 5.40
(This trading plan is for reference only and may vary based on your entry point and risk tolerance.)
Remember, trading strategies are just 10-20% of your overall success. The real key lies in effective risk management. Having a solid trading plan and proper position sizing are crucial for maintaining the right trading psychology. Master your risk management and stick to your plan.
Happy trading!

Pecca, able to breakout ?Is it possible for PECCA to make a healthy pullback and retest its resistance levels?
In the world of technical analysis, such a scenario often depends on market conditions and the stock's current momentum. A healthy pullback typically occurs when a stock temporarily retraces some of its gains after a strong upward movement, allowing it to consolidate and gather strength for another potential move higher.
If PECCA maintains its underlying bullish trend, a pullback to key support levels could provide a base for the stock to rebound and make another attempt at breaking or retesting resistance. Factors such as trading volume, overall market sentiment, and fundamental developments will also play a critical role in shaping this potential move.
Investors should closely monitor these levels and assess the broader market context to gauge the likelihood of a successful retest.
Disclaimer: Please be informed that all stock picks are solely for educational and discussion purposes; they are neither trading advice nor an invitation to trade. For trading advice, please consult your remisier or dealer representative.

RLOur algorithm has identified potential upward signals in the current market. Increased trading volume and prices above the EMA20 and EMA50 suggest a possible upward trend.
💡Trading idea dan plan:
✅Entry: 0.33
🛑Stop Loss @SL: 0.29
🎯Target Price @TP1: 0.37
🎯Target Price @TP2: 0.415
🎉Target Price @TP3: 0.455
(This trading plan is for reference only and may vary based on your entry point and risk tolerance.)
Remember, trading strategies are just 10-20% of your overall success. The real key lies in effective risk management. Having a solid trading plan and proper position sizing are crucial for maintaining the right trading psychology. Master your risk management and stick to your plan.
Happy trading!

NATGATEOur algorithm has identified potential upward signals in the current market. Increased trading volume and prices above the EMA20 and EMA50 suggest a possible upward trend.
💡Trading idea dan plan:
✅Entry: 2.14
🛑Stop Loss @SL: 1.85
🎯Target Price @TP1: 2.40
🎯Target Price @TP2: 2.70
🎉Target Price @TP3: 3.00
(This trading plan is for reference only and may vary based on your entry point and risk tolerance.)
Remember, trading strategies are just 10-20% of your overall success. The real key lies in effective risk management. Having a solid trading plan and proper position sizing are crucial for maintaining the right trading psychology. Master your risk management and stick to your plan.
Happy trading!

SNSOur algorithm has identified potential upward signals in the current market. Increased trading volume and prices above the EMA20 and EMA50 suggest a possible upward trend.
💡Trading idea dan plan:
✅Entry: 0.545
🛑Stop Loss @SL: 0.445
🎯Target Price @TP1: 0.675
🎯Target Price @TP2: 0.775
🎉Target Price @TP3: 0.875
(This trading plan is for reference only and may vary based on your entry point and risk tolerance.)
Remember, trading strategies are just 10-20% of your overall success. The real key lies in effective risk management. Having a solid trading plan and proper position sizing are crucial for maintaining the right trading psychology. Master your risk management and stick to your plan.
Happy trading!

PESONAOur algorithm has identified potential upward signals in the current market. Increased trading volume and prices above the EMA20 and EMA50 suggest a possible upward trend.
💡Trading idea dan plan:
✅Entry: 0.275
🛑Stop Loss @SL: 0.22
🎯Target Price @TP1: 0.33
🎯Target Price @TP2: 0.385
🎉Target Price @TP3: 0.44
(This trading plan is for reference only and may vary based on your entry point and risk tolerance.)
Remember, trading strategies are just 10-20% of your overall success. The real key lies in effective risk management. Having a solid trading plan and proper position sizing are crucial for maintaining the right trading psychology. Master your risk management and stick to your plan.
Happy trading!

JTIASA - Looking for strong bullish continuationEntry & exit strategy setup.
Watch for pullback until entry zone Fib line 0.382 - 0.5.
Strong resistance at 1.33.
The price is well above the Kumo, indicating a strong bullish trend.
The Tenkan-sen is above the Kijun-sen, confirming bullish momentum.
The Chikou Span is above the price, indicating no immediate resistance from past price levels.
Volume: Recent breakout above 1.30 was accompanied by a volume surge, confirming strong buying interest.
Trend Strength: The bullish trend is strong, with higher highs and higher lows forming.
Breakouts or pullbacks must be confirmed by higher-than-average volume.
A breakout with low volume may indicate a false move.
The Kijun-sen and Tenkan-sen should remain bullish for trend continuation.
Any significant bearish crossover may invalidate the trade idea.
Note:
1. Analysis for education purposes only.
2. Trade at your own risk.

E&O - Looking for strong bullish sentimentP wave
The breakout point (Entry on B/O) is marked at 0.965, indicating the breakout from the P Wave.
Confirmed by the volume spikes, especially in the latest breakout, which indicates strong interest.
The price is above the Kumo, indicating bullish momentum.
Chikou Span is above the price, confirming bullish bias.
Tenkan-sen is above the Kijun-sen, further affirming bullish momentum.
Entry on breakout above 0.980 with close monitoring of volume to confirm the strength of the breakout.
Analyze the broader market sentiment or sectoral trends. Bullish sentiment will increase the likelihood of the breakout holding.
Note:
1. Analysis for education purposes only.
2. Trade at your own risk

Simple13 Trading IdeaCurrent Price: RM 0.96
After previously breaking below the uptrend channel, the stock has shown resilience by rebounding back within the channel support. Despite heavy selling pressure over the past two weeks, the price has maintained a tight consolidation, indicating a potential rebound.
Trading Plan
Take Profit Area: RM 0.96 to RM 1.08 (within the upper range of the channel).
Entry Area: RM 0.96 to RM 0.925 (near the lower channel support).
Cut Loss: RM 0.90.
If the price drops below RM 0.90, it could signal a failure to hold the uptrend channel, and the pullback might go deeper than expected.
Summary
The stock shows positive signs of resilience within the uptrend channel, with consolidation forming a solid base for a potential rebound. If the price respects the channel support, it could offer a rewarding risk-to-reward setup.
Disclaimer: This post is for informational purposes only and not financial advice. Always perform your own analysis before making any trading decisions.
MYX:PANTECH

BMGREEN ready next potential rallyMulti weeks base formation + absence of sellers weekly + BO of pennant flag..
Next target would be RM3. TAYOR.


Systech, any reversal signal?
The chart displays a downward trend for SYSTECH. The stock price has been declining over the past few months, with a series of lower highs and lower lows.
* Resistance Levels: The stock has encountered resistance at the 0.400 and 0.350 levels, where it has struggled to break above. This indicates that there is significant selling pressure at these price points.
* Support Levels: The stock has found some support at the 0.250 level. However, it is important to note that this support level has been tested multiple times and may not hold in the future.
* Volume: The volume has been declining during the downtrend, which suggests that there is less interest from investors in the stock.
Potential Rebound or Continued Downward Trend:
Based on the current chart, it is difficult to predict a clear rebound. The stock may continue its downward trend if the current support levels break.
However, there are a few factors that could potentially lead to a rebound:
* News or Events: Positive news or events related to the company could trigger a buying interest and lead to a price increase.
* Technical Indicators: If technical indicators such as the Relative Strength Index (RSI) or Moving Averages start to show bullish signals, it could indicate a potential reversal.
* Market Sentiment: A change in market sentiment towards the stock could also lead to a rebound.
Important Considerations:
* It is important to note that technical analysis is just one tool and should not be used as the sole basis for investment decisions.
Disclaimer: Please be informed that all stock picks are solely for educational and discussion purposes; they are neither trading advice nor an invitation to trade. For trading advice, please consult your remisier or dealer representative.

TH Plant - Wedge Breakout (A+ Swing Trade Setup)TH Plant Wedge Breakout (A+) - Swing trade
CP - Wedge Breakout
RSI > 50 (Rebound at 50 during Entry)
SCDMX - Red Candle 20% (Strong Institution influence)
AP - 1st Buy Signal
2nd Confluence (A+)
A+ Setup - Breakout on the 4th rebound point on the strong upward trendline
CD - Tweezer Bottom on the rebound point
Entry Price Close above 200SMA
www.tradingview.com
EP - 0.675
TP - @ R0.715 / @R0.775 / TP @ 0.8 (XOX) / @ R0.840
SL - @0.61 (below previous low)
R:R - 1:2
Market Condition - KLCI is rebounding on 200SMA with Morning Star CD.
Bursa Plantation Index - Still Bullish with RSI > 50. But in Consolidation upon entry and rebound on closing.
FCPO Index - Bullish.
All the best guys. Will let you know the results.

GAMUDA GOING FOR MARK UPVery nice Re-Accmulation Pattern here
I have been actively Accmulating the share since MId September 2024 :
These are my list of Entry & Exit :
1st POE : 17/9/2024 (Black Arrow)
2nd POE : 9/10/2024 (Black Arrow)
-EXIT : 21/10/2024 (Red Arrow)
Re-Initiated PE :
1st : 22/10/2024 (Black Arrow, This time i went with Full Position)
2nd : 4/11/2024 (Blue Arrow, I went with Overweight Position)
Purely Wyckoff Entry, i always aiming for, a condition in which i am in Assymetrical Leverage

NATGATE GOING FOR MARK UPThis is a Classic, Re-Accumulation #2 (Rising Bottom)
Since 16/10/2024, i noticed supply seems to be evaporating
With influx of demand
**Red Arrow
I wait for the price to BO from the BUEC area
then position initiated as attached @ 5/11/2024
PureWyckoff

RAPID GIVE NICE SETUP AND VOLUME, GOOD TO HOLDThis Weekly FORECAST
Opportunity for RAPID. This setup is my trading idea/plan, if you want to follow: trade at your own risk (TAYOR).
Risk Factors:
1. Market conditions, unexpected news, or external events could impact the trade.
2. Always use risk management strategies to protect your capital.

CHGP - Uptrend may EXTEND in near term ?CHGP - Current Price : RM2.27
CHGP is bullish as the price is above 50 & 200 days EMA . It is currently forming a Bullish Pennant Pattern. Chart Pattern traders may wait for a valid BREAKOUT this pattern to trigger a buy signal.
Based on ICHIMOKU CHART, the stock made a breakout above CLOUD on 22 OCT 2024 which provides a buy signal. CHIKOU SPAN already moving above candlestick (which indicates a bullish scenario). At current moment, CHIKOU SPAN is inside the CLOUD and heading towards its resistance (LEADING SPAN 2 - the upper side of CLOUD). If the CHIKOU SPAN make a new high above the CLOUD, it will strengthen more the BULLISH outlook for this stock. As such, ICHIMOKU CHART traders may wait for the CHIKOU SPAN to break above the CLOUD to trigger a good buy signal.
Notes : CHIN HIN GROUP BERHAD is the largest shareholder of CHGP. Approximately holding 54.94% stake.

PERDANA - Buy on weakness and sell on rebound/strength ?PERDANA - Current price : RM0.285
PERDANA is bearish in technical view as the price is below 50 and 200 days EMA.
Yesterday 20 November 2024, the company posts stronger 3Q Profit and Revenue. Revenue rose 23% to RM127.25 million, with third-party vessel contributions increasing 27%. Net profit jumped 232% YoY to RM75.80 million, supported by higher vessel utilisation and improved charter rates.
Today 21 November 2024, the stock opened gap up at RM0.310 (rose 8.77% from previous day closing price). The stock were traded between RM0.310 (high) and RM0.280 (low). Finally the stock closed at RM0.285 (unchange from yesterday closing price).
In view of Technical Indicator, there is no buy signal. But here i anticipate to buy at closing price RM0.285 because there is a psychology behind the share price movement. The share price made gap up on the morning session indicates there are some investors view this stock value to buy in higher price. However, the share price didn't sustain at high price and closed at lower indicates that the insiders have sold their shares as they bought early at discounts price.
As a trader, i will buy this stock for short term because once the selling pressure absorbed and become oversold, the stock may bounce and make a rebound to higher price. As such, i will buy at RM0.285 and target to sell at RM0.305 (one bid below today high - profit +7%). My support level will be RM0.270 (cutloss at RM0.265 - loss -7%). So the risk reward ratio will be 1:1.
ENTRY PRICE : RM0.285
TARGET : RM0.305 (+7%)
SUPPORT : RM0.270
CUTLOSS : RM0.265 (-7%)
Notes : The share price bounced at RM0.270 (support level) almost 10 times indicates that the support level is significant.
