NOVAMSC - Need strong momentum to push price upward.Is there any strong momentum to push the price upward? Price is above up Kumo but Tenkan Sen, Kijun Sen & Senkou Span A as a resistance to be breakout.
N wave projection with E, V, N & NT target. NT is the nearest target to be achieve. Price need to breakout 52w High to achieve the rest target. Support at 0.155

HIAPTEK - POTENTIAL PRICE TARGETPrice just cross above the "KUMO" and with using N wave analysis, NT, N & E is the targeted potential price to be achieve. If the strong momentum continue and break the 52w High, next potential target as per fibo line as shown in the chart. NT will be the nearest support if price continue going up or as a resistance if pullback is happened.
Analysis for learning purposes.
Trade at your own risk.

CENCOF - Analysis on price movementN wave with E, V & N projection target. Price closed at Senkou span B as a support. Also Senkou span A as a nearest resistance. Price is above kumo at this moment but need a strong momentum to keep upward and to breakout 52w High (0.420) to reach V & E projection.
Note:
1. Analysis for education purpose.
2. Trade at your own risk.

MELEWAR - Analysis on price movementExit & Entry strategy setup. Awaiting at T3 for potential entry. Price is above Tenkan Sen, Kijun Sen and up Kumo. Need momentum to breakout 52w high (0.325) to reach the target price.
None:
1. Analysis for education purpose only.
2. Trade at your own risk.

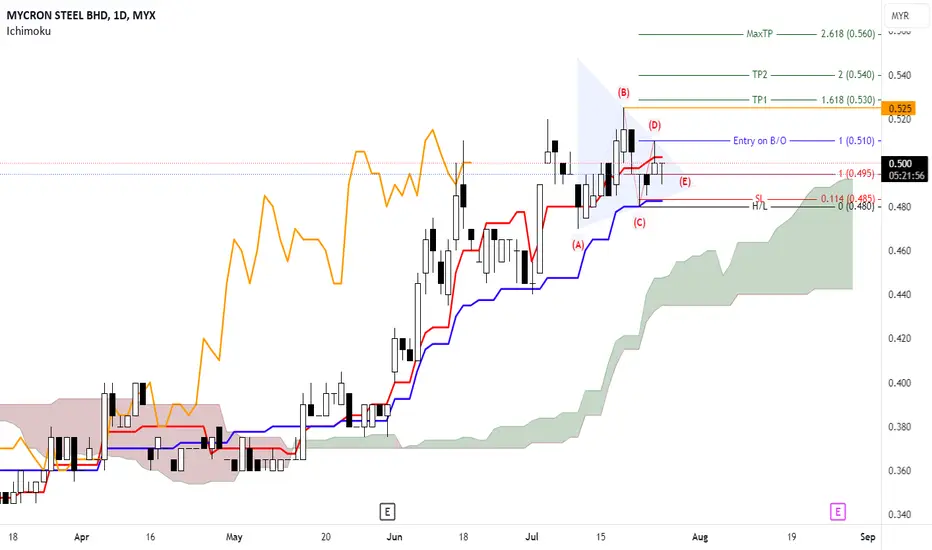
MYCRON - To keep strong momentum for continue uptrendP wave projection.
Price need to breakout turning point (D) and 52w high (0.525) to reach all the target.
Nearest Support is Senkou Span A and Kijun Sen.
Nearest Resistance is Tenkan Sen.
Price is above up Kumo at this moment.
Note:
1. Analysis for education only
2. Trade at your own risk.
MIKROMB - Analysis on prive movementN wave with E, N & NT projection.
Resistance - Tenkan Sen
Support - Kijun Sen
Price need to breakout NT with high volume to reach all target price.
Note:
1. Analysis for education purpose only.
2. Trade at your own risk.

HPMT - Analysis on price movementN wave with E, V, N & NT projection.
Support - Kijun Sen
Resistance - Tenkan Sen
Price need to breakout turning point (B) with high volume to reach all price target.
Note:
1. Analysis for education purpose only.
2. Trade at your own risk.

EVERGRN - Analysis on price movementP wave, reached (E).
Entry on breakout turning point (C) and breakout 52w high to achieve target price.
Tenkan Sen as a nearest support.
Note:
1. Analysis for education purpose only.
2. Trade at your own risk.

Topglove's cycle analysis. 7/August/24TOPGLOV may just completed wave (II)(Red) as its price near multi Confluence zone of :- 1) POC of Volume Profile (Red Horizontal) 2) Lower Support of Parallel Channel (blue). P/s what make health care stock sector grow? e.g Glove as most stocks crash!? "Sector Rotation"?! Anyway Hartalega just announced its "better" than its previous Quarterly report.

Tenaga. Malaysian. Grab electrical bill >32.97% discount!TNB, Tenaga with its cycle now trending down till year end its share price probably could down till 9.80 +/-. which is the POC of volume Profile and parallel trendline support and demand zone.

Omesti finish down trend aroun 0.055Base on fibo level and trend lines.. The chart is still downtrend.. Try look buy at 0.055

BINTAI KINDEN CORPORATION BHDBintai Kinden Corporation Bhd
Trend: The stock has been in a strong uptrend since late June 2024, with the price rising sharply from around 0.080 to a high of 0.145.
Price Action: Recent price action shows large bullish candles, indicating strong buying pressure. However, the last few candles suggest some consolidation or potential pullback.
Moving Averages: The price is trading well above both the short-term (likely 20-day) and long-term (likely 50-day or 200-day) moving averages, confirming the bullish trend.
Support and Resistance: The previous resistance around 0.100 may now act as a support level. The recent high of 0.145 could be considered as immediate resistance.
Volume: There's a significant increase in trading volume during the recent price surge, supporting the bullish move.
Volatility: The stock has experienced increased volatility in recent weeks, with larger price swings compared to its historical pattern.
Indicators: While not explicitly shown, the steep price increase suggests overbought conditions on momentum indicators like RSI.
Pattern: The chart shows a clear breakout from a long period of consolidation, followed by a strong upward movement.
Given the sharp rise, traders should be cautious of potential pullbacks or consolidation. However, the overall trend remains bullish as long as the price stays above key support levels and moving averages.

L & P - good quater earning
- good demand background (End-to-End Industrial Packaging and Circular Logistics Solutions)
- good investors lineup
- long position as now price a good support line


AZRBAZRB making good and strong support
support near or at area 0.19
entering point at 0.19,
aim for long to the next R at 0.30-0.365
good fundamentally and financially quite established, this will soar up this week or next week eventually!

FAJAROver 12 months, Fajarbaru Builder Group Bhd reported revenue of RM319m, which is a gain of 48%
Fajarbaru Builder Group Bhd has a total shareholder equity of MYR434.7M and total debt of MYR49.9M, which brings its debt-to-equity ratio to 11.5%
Fundamentally is still green
now price is retraced at new support
i personally choose to Long position for this counter.

Berjaya Corp Bhd (KL:BJCORP) has signed separate agreements with two Chinese firms to explore sales collaboration in Malaysia and Southeast Asia
company will explore using its distribution network in Malaysia to boost the reach of home appliance maker Skyworth Group Co Ltd, Berjaya Corp said in a statement. The collaboration may also lead to the implementation of residential, commercial and industrial photovoltaic systems
agreed with electric vehicle maker Skywell New Energy Automobile Group Co Ltd to establish its brand in Malaysia and Southeast Asia. “This endeavour may include exploring strategic partnership to advance essential technologies and bolster the ecosystem in the country
will strengthen the talents and localisation of the entire industrial chain while creating landmark projects for China and Malaysia's trade cooperation.
"We also look forward to further promoting exchanges and cooperation between China and Malaysia in the fields of economy, trade, science and technology, and culture through this cooperation

Notion VTec Bhd (KL:NOTION) share price reached a decade high on Tuesday, said the surge could be attributed to its strong financial performance recovery, an industry turnaround, and heightened investor interest
Notion said it recorded positive returns for the first two quarters of the current financial year ending Sept 30, 2024 (FY2024), leading to favourable responses from both retail and institutional investors, indicating confidence in its future prospects.
group reported a net profit of RM14 million for the second quarter ended March 31, 2024 (2QFY2024), a significant turnaround from a net loss of RM7.77 million a year earlier, driven by higher revenue. Revenue rose 21.8% to RM111.6 million from RM84.7 million, mainly due to strong performance of the electronics manufacturing services and hard disk drive (HDD) segments.
At RM1.96, Notion's market capitalisation has surpassed RM1 billion. The stock has gained over 500% year-to-date.

ZECON BHDZECON BHD
Trend: The stock is in a strong uptrend since May 2024. The price has been making higher highs and higher lows, indicating bullish momentum.
Price Action: Recent price action shows a pullback from the peak around 0.570. The current price (0.535) suggests a potential consolidation or minor correction within the larger uptrend.
Moving Averages: The price is trading above both the short-term (likely 20-day) and long-term (likely 50-day or 200-day) moving averages, which is bullish. The moving averages are also sloping upwards, confirming the uptrend.
Support and Resistance: Immediate support appears to be around 0.520-0.530 level. The recent high of about 0.570 serves as the nearest resistance.
Volume: There are some volume spikes visible, particularly during the strong upward moves, indicating buyer interest.
Volatility: The stock has shown increased volatility since May, with larger price swings compared to earlier periods.
Candlestick Patterns: Recent candles show some indecision with both upper and lower wicks, suggesting a potential consolidation phase.
Overall Outlook: The technical picture remains bullish overall due to the strong uptrend and price above moving averages. However, the recent pullback suggests caution and the possibility of a short-term consolidation or correction before potentially resuming the uptrend.

Melati Ehsan Holdings BhdMelati Ehsan Holdings Bhd
Trend: The stock has been in a strong uptrend since late June/early July 2024. Prior to this, it was trading in a sideways range for several months.
Price Action: There's a significant price breakout visible in July, with the stock price rising sharply from around 0.54 to a high of 0.675.
Support and Resistance:
Current support level appears to be around 0.60-0.61
Resistance level can be seen at the recent high of 0.675
Volume: There's a noticeable increase in trading volume coinciding with the price breakout, indicating strong buying interest.
Moving Averages: The stock price is currently trading above both the short-term (likely 50-day) and long-term (likely 200-day) moving averages, which is generally considered bullish.
Volatility: The stock has shown increased volatility since the breakout, with larger price swings compared to its previous range-bound behavior.
Recent Price Action: After reaching the high, there's been a slight pullback, which could be a normal retracement after a strong move up.
Potential Patterns: The recent price action might be forming a bull flag pattern, which if confirmed, could suggest further upside potential.
Overall, the technical indicators suggest a bullish outlook for the stock in the short to medium term, but traders should be cautious of potential consolidation or further retracement after the recent strong move up.

SEAL IncorporatedSEAL Incorporated
Trend: The stock is in a strong uptrend, especially since May 2024. The price has moved significantly higher from around 0.55 to current levels above 0.70.
Moving Averages: Two moving averages are visible on the chart (likely 50-day and 200-day). The price is currently above both MAs, which is bullish. The shorter-term MA has crossed above the longer-term MA, forming a "golden cross" - another bullish signal.
Support and Resistance: The previous high around 0.80 seems to be acting as resistance. Support levels can be seen around 0.70 and 0.60.
Volume: There was a significant spike in volume during the recent price surge, indicating strong buying interest.
Price Action: The stock recently formed a bullish gap up, followed by some consolidation. This could be a sign of continued bullish momentum.
Volatility: The stock has shown increased volatility in recent months, with larger price swings and candle sizes.
Pullback: The most recent candles show a slight pullback from the highs, which could present a potential buying opportunity if the uptrend continues.
Indicators: While not all indicators are visible, the price action and moving averages suggest bullish momentum.
Overall, the technical analysis suggests a bullish outlook for SEAL Incorporated, with strong momentum and uptrend in place. However, traders should be cautious of potential resistance around the 0.80 level and monitor for any trend reversal signals.

KJTS Group BerhadKJTS Group Berhad
Trend: The stock shows an overall uptrend since February, with higher lows and higher highs.
Price Action: There's significant volatility, with large price swings and several gap-up and gap-down movements.
Support and Resistance:
Current support level appears to be around 0.700 MYR
Recent resistance level is at about 0.835 MYR (the recent high)
Moving Averages: Two moving averages are visible:
The shorter-term MA (likely 20-day) in blue is above the longer-term MA (possibly 50-day) in green, indicating bullish momentum.
Price is currently above both MAs, which is typically bullish.
Volume: Volume spikes are visible during major price movements, particularly in February and June.
Recent Performance: The stock recently touched a high around 0.835 MYR before pulling back. It's currently consolidating near the 0.730 MYR level.
Patterns: There are several noticeable bullish and bearish candles, including potential hammer and shooting star formations.
Indicators: Without additional indicators overlaid, it's limited what can be inferred beyond price and volume action.
Overall, the stock appears to be in an uptrend but is currently in a consolidation phase. Traders might watch for a breakout above recent highs or a breakdown below support levels for potential entry or exit points.

Haily Group Berhad (HAILY)Haily Group Berhad (HAILY)
Trend: The stock is in a strong uptrend since March 2024. The price has been consistently making higher highs and higher lows.
Moving Averages: The price is trading above both the short-term (likely 20-day) and long-term (likely 50-day) moving averages, indicating bullish momentum.
Support and Resistance: The most recent high around 0.935 MYR serves as the immediate resistance. Support levels can be seen around 0.800 MYR and 0.720 MYR.
Volume: There's been a significant increase in trading volume since June, suggesting strong interest in the stock.
Price Action: The stock recently experienced a sharp pullback from its highs, which could be a healthy correction within the uptrend.
Bollinger Bands: The price has been trading near the upper Bollinger Band, indicating strong momentum but also the possibility of being overbought.
Relative Strength: The stock has shown considerable strength compared to its performance earlier in the year.
Potential Patterns: There might be a small bull flag forming after the recent pullback, which could suggest a continuation of the uptrend if the price breaks above the flag.
Overall, the technical indicators suggest a strong bullish trend, but the stock may be approaching overbought levels. Traders might watch for a potential consolidation or further pullback before considering new entries.
