MYEGThis Week FORECAST
Opportunity for MYEG. This setup trading idea is for intraday. >> TAYOR
Risk Factors:
1. Market conditions, unexpected news, or external events could impact the trade.
2. Always use risk management strategies to protect your capital.

BUY SETUP ELRIDGE#ELRIDGE 15042025
ep - 0.505
sl - 0.455 (9.9%)
tp - 0.555 (9.9%)
rrr - 1X
High Risk

SMRT!!! ]
TAYOR
.
.
.
This message is for education and information purposes only. It shall not be construed as an offer/solicitation or recommendation to buy/sell any stocks.

CREST - Looking for bullish sentimentPrice is still below the Kumo, indicating that the overall trend remains bearish.
A downtrend line has been broken, suggesting a potential trend reversal.
Potential golden cross but happened below Kumo suggesting a weak bullish signal.
Chikou Span is below price candles, signaling potential resistance ahead.
The stock is approaching the the Kumo, which can act as resistance. A successful breakout through this Kumo would enhance bullish sentiment.
Price attempted to break above the 0.205 level, but has closed at 0.200 (-2.44%), showing hesitation.
Consider entering a buy position ideally above 0.205.
If the price can stay above 0.205 with higher volume it would provide stronger confirmation of the bullish trend.
Place a stop loss at 0.185, just below recent support, to mitigate risk in case the breakout fails.
Note:
1. Analysis for education purpose only.
2. Trade at your own risk.


Genting on its way down to close its previous gapGiven the global economic turmoil, Genting might well be on its way to trend below RM3.00 to close its previous gap. The gap lies within the fibo 0.786 while the lower support level is around RM2.50

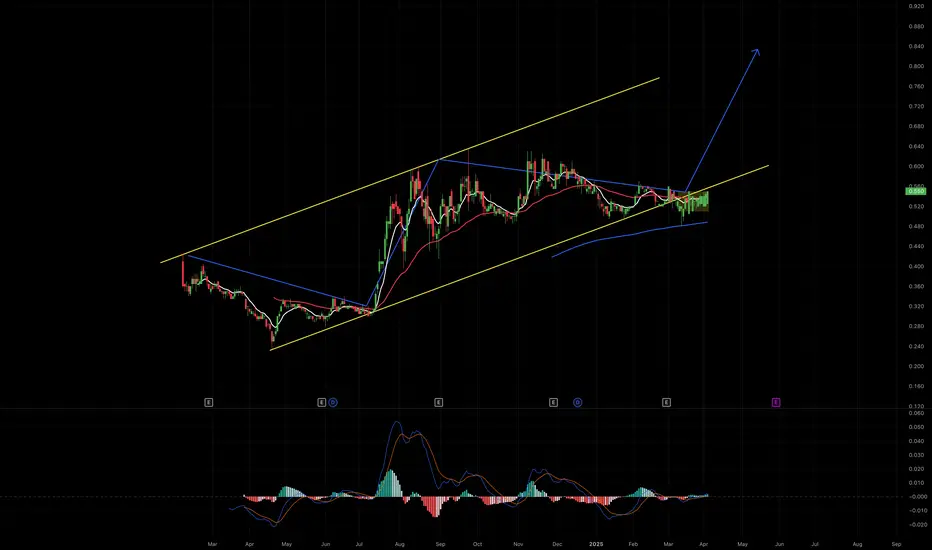
AGX - Bullish Wedge Bullish Wedge CP Pattern on the Daily Timeframe (Daily TF)
The Bullish Wedge CP (Continuation Pattern) is a technical chart pattern that signals a potential uptrend continuation after a period of consolidation. On the daily timeframe, this pattern can provide strong signals for medium to long-term entries.
Characteristics of the Bullish Wedge CP Pattern:
Previous Trend is Uptrend:
This pattern appears after a strong upward price movement.
Price Moves in a Contracting Formation:
Price forms a narrowing wedge — with lower highs and lower lows that converge over time.
Declining Volume:
During the wedge formation, volume usually decreases, indicating a market pause or rest.
Breakout to the Upside:
Once the price breaks the resistance of the wedge with increasing volume, it signals a strong bullish continuation.
Continuation Pattern Confirmation:
After the breakout, the price typically retests the breakout zone before continuing upward — this indicates a healthy trend continuation.
Entry Strategy:
Entry: After a breakout and a confirmation candle closes above the wedge line.
Stop Loss (SL): Placed below the wedge’s low.
Take Profit (TP): Use the wedge’s height projection or target the next resistance level.
Buy Edaran BHD ideaTrading Idea: Edaran BHD
A major Break of Structure (BOS) has occurred, indicating a potential increase in the market price. Following this, a liquidity sweep suggests that buyers are gaining momentum, possibly absorbing sell-side pressure.
A minor BOS and the presence of a bullish Marubozu candlestick on Weekly provide strong confirmation for a potential long entry.
• Entry Price: RM1.54
• Target Price: RM2.56
This setup indicates a bullish bias with expectations of continued upward momentum.

WILL ECOMATE MARK UP?This is Schematic #2 Rising Bottom of Re -Accumalation
I am attracted to the TriggerBar on 11/3/25, which succesfully commit above the upper trading range
In which subsequently reacted with a very low supply (Arrow)
Made a decision for EP
Going to expose progressively, if things improving from here on wards
Bursa KLCI has been under massive selling
Im expecting a volatility in upcoming weeks
PureWcykoff

RAMSSOL CONTINUE MARKING UPI have been following ramssol since my last position
For ramssol, this is an Atypical Type #2 Re-Accumulation Schematic
The Rising Bottom
Based on the chart, I bought @ 6th Jan , i assumed that ramssol was at Phase D incoming to the phase E , awaiting for markup.
However somehow price plummeted (18th Feb) and i managed to secure some profits.
Since then, what interesting to me, is that, ramssol has 4 undercut (orange arrow) and price making uptrend
-These 'undercut' can be considered as 'Stepping Stone SPRING'
from the volume side, supply successfuly absorbed with succesful test of the 'Spring'
Position initiated as attached
Pure Wyckoff
Tight SL

KPJ MARKING UPThis is just a continuation from my previous KPJ thesis
**(Link attached below)
Looks like current price action is on going Buec to me
Thus, Ep initiated around 2.56-2.58

RANHILL - Looking for bullish momentum.The stock appears to be in a downtrend but is showing potential for a reversal with a breakout pattern forming.
A breakout just occurs above the downtrend line suggests a potential bullish reversal.
The price is currently below down Kumo, which indicates resistance. A breakout above Kumo could reinforce bullish momentum.
Monitor the trading volume during breakout attempts. Increased volume is a strong confirmation signal for a breakout.
Y wave with target movement towards point (E) within stipulated time.
Suggested entry on breakout with all the TP.
Set a proper stop loss, ensuring a manageable risk-reward ratio.
Note:
1. Analysis for education purpose only.
2. Trade at your own risk.

JCY
BUY now or WAIT later? TAYOR
This message is for education and information purposes only. It shall not be construed as an offer/solicitation or recommendation to buy/sell any stocks.

TTVHB
Breakout, pullback, entry? Why wait for pullback? Market moves by Fear & Greed of the participants (Day trader, Contra player, position trader, etc). Thats why we should always look for retracement around the key level after major moves to be safe. Don't chase, if she's the one she will come to find you!!! eh. TAYOR
This message is for education and information purposes only. It shall not be construed as an offer/solicitation or recommendation to buy/sell any stocks.


AWANTEC
TAYOR
This message is for education and information purposes only. It shall not be construed as an offer/solicitation or recommendation to buy/sell any stocks.

CDB Trading Plan: Smart 2:1 Strategy for Steady GainsCDB Trading Plan
Entry Price (EP): RM3.33
Take Profit (TP): RM3.40 (2% gain)
Stop Loss (SL): RM3.30 (1% loss)
Risk-Reward Ratio: 2:1
Strategy:
Enter at RM3.33 when the price shows bullish confirmation (e.g., strong green candle, positive momentum).
Exit at RM3.40 for a 2% profit or cut losses at RM3.30 to minimize risk.
Risk only 1-2% of your total capital for controlled exposure.
Tip: Monitor volume spikes or positive market sentiment for improved entry timing.

SIME Trading Plan: 2:1 Risk-Reward Strategy for Steady GainsSIME Trading Plan
Entry Price (EP): RM1.96
Take Profit (TP): RM2.00 (2% gain)
Stop Loss (SL): RM1.94 (1% loss)
Risk-Reward Ratio: 2:1
Strategy:
Enter at RM1.96 with bullish confirmation (e.g., strong green candle or volume spike).
Exit at RM2.00 for profit or RM1.94 to limit losses.
Risk only 1-2% of total capital for controlled exposure.
Tip: Monitor for positive market sentiment or strong sector performance for added confidence.

PMETAL Trading Plan: Simple 2:1 Strategy for Steady GainsPMETAL Trading Plan
Entry Price (EP): RM4.98
Take Profit (TP): RM5.08 (2% gain)
Stop Loss (SL): RM4.93 (1% loss)
Risk-Reward Ratio: 2:1
Strategy:
Enter at RM4.98 with bullish confirmation (e.g., strong green candle or volume spike).
Exit at RM5.08 for a 2% gain or cut losses at RM4.93 if the price weakens.
Risk only 1-2% of total capital for controlled exposure.
Tip: Watch for market sentiment and PMETAL-related news for optimal entry timing.

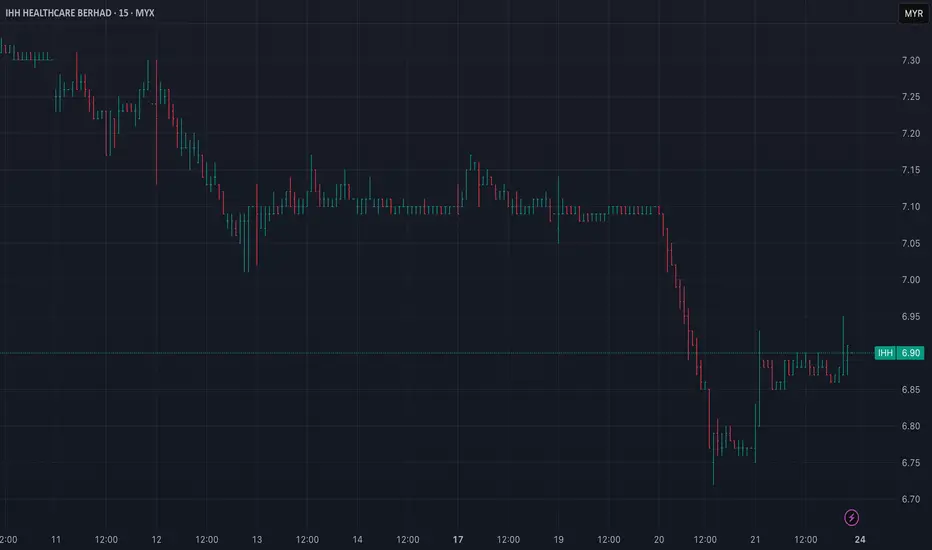
IHH Trading Plan: Simple 2:1 Strategy for Steady GainsIHH Trading Plan
Entry Price (EP): RM6.87
Take Profit (TP): RM7.01 (2% gain)
Stop Loss (SL): RM6.80 (1% loss)
Risk-Reward Ratio: 2:1
Strategy:
Enter at RM6.87 on bullish confirmation (e.g., breakout or strong buying momentum).
Exit at RM7.01 for profit or cut losses at RM6.80.
Risk only 1-2% of total capital for controlled exposure.
Tip: Watch for sector news or earnings updates to support bullish momentum.
TENAGA Trading Plan: Simple 2:1 Strategy for Consistent GainsEntry Price (EP): RM13.56
Take Profit (TP): RM13.83 (2% gain)
Stop Loss (SL): RM13.42 (1% loss)
Risk-Reward Ratio: 2:1
Strategy:
Enter at RM13.56 with bullish confirmation.
Exit at RM13.83 or cut losses at RM13.42.
Risk only 1-2% of total capital.
Tip: Monitor news and market sentiment for better timing.