Karex, how traders and inventor react?The stock began its pullback on February 18th but faced heavy selling pressure on February 28th, resulting in a sharp decline. It broke multiple support levels and recorded a significant 16% loss, signaling strong bearish momentum.
The MACD remains in a downward crossover (DC) and is below the zero line, indicating continued weakness and a lack of bullish momentum. This suggests that sellers remain in control, and the stock has yet to show signs of stabilization or reversal.
Going forward, it is crucial to monitor whether the stock can establish a support base and regain key resistance levels. A confirmed reversal would require a bullish divergence, a trend shift with higher lows, or a breakout above key resistance levels.
Disclaimer: This analysis is for informational purposes only and should not be considered financial advice. Market conditions can change rapidly, and past performance is not indicative of future results. Always conduct thorough research and consult a qualified financial professional before making investment decisions.

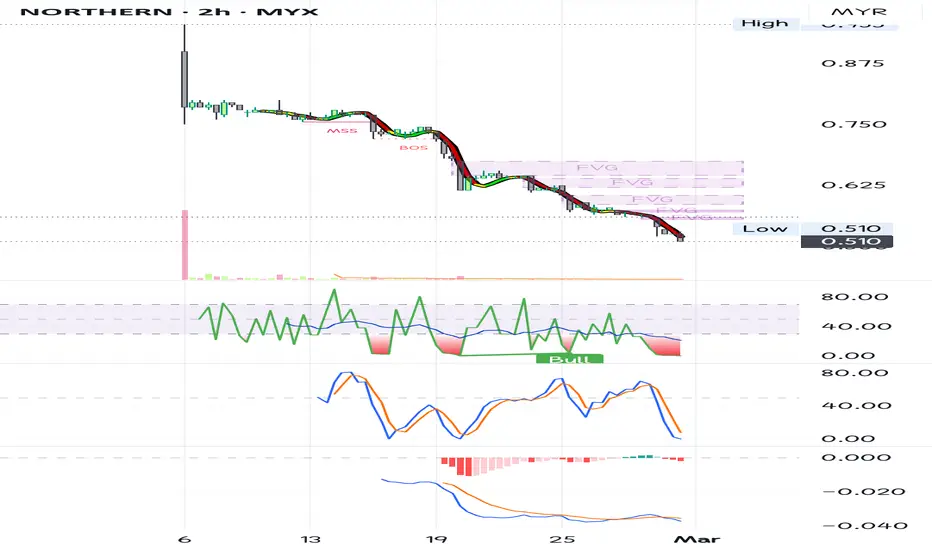
NORTHERN, go southern?The stock price continues to decline, making capital protection a priority. Cutting losses (CL) quickly may be necessary to mitigate further downside risk.
Currently, the Relative Strength Index (RSI) is in oversold territory, indicating potential exhaustion in selling pressure. However, the Moving Average Convergence Divergence (MACD) remains in a downward crossover (DC), suggesting that bearish momentum is still intact.
As of now, there is no clear signal of a rebound. For a trend reversal to be confirmed, the stock needs to establish a pattern of higher highs and higher lows, forming an upward staircase. A decisive breakout above a key resistance level would be the first sign of a potential trend reversal.
Disclaimer: This analysis is for informational purposes only and should not be considered financial advice. Always conduct your own research and consult with a qualified financial professional before making any investment decisions.
EKOVESTWe will Expect price of EKOVEST will go to RM0.70 (Minimum) movement due to Ending of Corrective Movement. Fundamental Approach also to be considered where this company have a long-term profitability. Do Your Own Analysis and TAYOR

OSK HOLDING, Long Position at RM1.69 ?Possible Big Move coming for Earnings ? As you can see, now the price of this stock's approaching to end of the impulsive wave which is a Wave 5 by making an Inverted Head and Shoulder Pattern to end the corrective Wave 4. With possible outcomes of the price might making a right shoulder at RM1.69 - 1.67 and Targeting to RM1.90 UPWARD MOVEMENT. TAYOR everyone !

KPJ MARKING UPAn Atypical Re-Accmlation Schematic #2 (Rising Bottom)
With Supply evaporating (Green Arrow)
In the Background of Local Spring,
All these, with my assumption that, the St (phase B),
acting as a Change of Character (Choch)
entry n Stop loss as attached
Pure Wyckoff

Public Bank Buy SignalP/E trend about industry rate of 11.3. Strong financial a head due strong borrowing for businesses. Continue buy signal 4.48, quarterly results out soon.

ClOUDPTLooking for long Position @ RM 0.81, Invalidation Level @ RM 0.75 and Target Price is RM 1.15 . Reason for long this stock is due to corrective phase Wave (IV) and expecting price would make an Expanding Diagonal for Wave V . Hence, Fundamental of this Company should be considered for long-term perspective. TAYOR !

AWCThe price struggled to hold above the 1.140 area, indicating weakness in the current trend. The next key support level to watch is around 0.960. If the price stabilizes here, it may enter a consolidation phase. However, if this support level is broken, further downside pressure is likely.
Although the RSI is in the oversold zone, suggesting that the stock may be due for a rebound, traders should remain cautious. The MACD has formed a bearish crossover (DC), reinforcing the downside momentum. This suggests that any recovery could be short-lived unless strong buying interest emerges.
Going forward, traders should monitor whether the price can hold above support and look for confirmation signals before anticipating a reversal. A clear breakdown below 0.960 could trigger further selling pressure.
Disclaimer: This analysis is for informational purposes only and should not be considered financial advice. Please conduct your own research or consult with a professional before making any investment decisions.

CMSB....The stock is facing 1.160 as the nearest resistance level, which could act as a hurdle for further upside movement. Meanwhile, both the RSI and Stochastic RSI are in the overbought zone, indicating that the stock may be overextended in the short term.
Despite this, the MACD remains below zero, suggesting that the broader trend has yet to fully turn bullish. Given these mixed signals, the key question for the coming week is whether the stock will experience a pullback before attempting another breakout.
Traders should watch for signs of weakness near resistance and monitor whether the price can establish a higher low to sustain an uptrend. A healthy retracement could provide a better entry opportunity, while a strong push above resistance may signal a shift in momentum.
Disclaimer: This analysis is for informational purposes only and should not be considered financial advice. Please conduct your own research or consult with a professional before making any investment decisions.

IJM, at bottom? Or ...The stock continues to decline, showing no clear signs of a reversal yet. The price remains in a downtrend, with each move lower reinforcing the bearish momentum.
At the moment, 2.10 serves as the key support level, where buyers may attempt to defend the price. On the upside, the nearest resistance zone is around 2.40 – 2.55, which must be cleared for any meaningful recovery.
To break out of this downtrend, the stock needs to establish a more structured pattern, essentially building a "staircase" of higher lows and higher highs. Without this formation, any upward movement may struggle to gain traction.
Disclaimer: This analysis is for informational purposes only and should not be considered financial advice. Please conduct your own research or consult with a professional before making any investment decisions.

VSTECS, looking for next support?The price has closed below the moving average (MA) line, signaling potential weakness in the trend. Additionally, the MACD indicator is below zero, reinforcing a bearish sentiment. However, a key downtrend line remains in play, and a breakout above this resistance level could shift momentum.
On the downside, strong support is seen around the 3.35 area, which coincides with an uptrend line acting as a crucial support level. A break below this zone may lead to further downside pressure, while a rebound could indicate renewed buying interest.
As always, market makers' next move will be key in determining the stock's direction. Traders should monitor price action closely and manage risk accordingly.
Disclaimer: This analysis is for informational purposes only and should not be considered financial advice. Please conduct your own research or consult with a professional before making any investment decisions.

HARTA, near support?The price is currently testing the support level around the 2.38 area. The key question now is whether this level will hold and trigger a short-term rebound or if the selling pressure will persist, leading to a breakdown below support.
Several factors will determine the next move: market sentiment, trading volume, and broader trend direction. A strong bounce with increasing volume could signal a temporary reversal, while a decisive break below 2.38 might indicate further downside ahead.
Traders should watch for confirmation signals, such as candlestick patterns, momentum indicators, and any external catalysts, before making their next move.

Eastern & Oriental Bhd - Potential Bullish Reversal Pattern# Technical Analysis: Eastern & Oriental Bhd (E&O) - Potential Bullish Reversal Pattern
Looking at the E&O chart (ID: MYX), I can see that the stock is currently trading at 0.845 MYR, up 0.030 (+3.68%). The chart shows several key technical patterns and trade setups:
## Current Position Analysis
- Trading near support at 0.845 MYR
- Open position: 2,105 shares
- Target price: 1.105 MYR (+30.18%)
- Stop loss: 0.755 MYR (-11.24%)
- Risk/Reward ratio: 2.68 (favorable)
## Technical Indicators
The price action is currently showing signs of a potential reversal, with:
1. Multiple moving averages beginning to flatten and potentially cross
2. Price testing a horizontal support zone (highlighted in blue)
3. Recent bounce from support with increased volume
## Long-Term Perspective
The chart displays a complete market cycle from 2023-2025:
- Strong uptrend through late 2023 into early 2024
- Distribution phase in March-April 2024
- Downtrend through mid-2024
- Current consolidation/potential accumulation phase
## Trading Signals
Several key sell signals were triggered at the top, with more recent buy signals appearing near support. The drawn trendlines suggest a large descending triangle that may be resolving to the upside if support holds.
## Outlook
The current setup appears to be forming a potential inverse head and shoulders pattern with:
1. Left shoulder (October-November 2024)
2. Head (December 2024-January 2025)
3. Right shoulder forming now (February-March 2025)
If price breaks above the neckline with increased volume, the measured move target of 1.10 MYR appears reasonable, aligned with the charted target price of 1.105 MYR.

CHB Support and ResistanceThe stock is currently trading at 0.845 MYR, up 0.010 (+1.64%).
Key technical indicators visible:
Moving averages (multiple SMAs: 10, 20, 50, 200)
Trading volume (Vol 20: 631.7K)
Several buy/sell signals on the chart
The chart shows a recent trading range with:
Current price: 0.845
Target price appears to be 0.955 (+29.6%)
Stop loss set at 0.755 (-11.6%)
Risk/Reward ratio: 2.68
There's an open position with quantity of 2,105 shares.
The chart displays price action over several months from approximately February 2023 to May 2025, with multiple buy/sell signals marked along the price movement. The stock appears to have experienced some volatility, with significant price movements in June-July and September-October periods.

CMSB - Breakout Down Trendline ?CMSB - CURRENT PRICE : RM1.10
CMSB had broken down trendline on high trading volume - indicating strong buying interest.
This is possible beginning of trend changing from downtrend to uptrend. Furthermore, the reading in RSI crosses above 50 added more bullish outlook for this stock.
Technically i would buy on this breakout point as it suggest an attractive RISK to REWARD ratio.
ENTRY PRICE : RM1.10
TARGET : RM1.20 , RM1.29 , RM1.42
STOP LOSS : RM1.00
Notes : There is a catalyst for this stock. Investors may refer to TheEdge website (date 19 FEB 2025) - CMSB books highest quarterly net profit in more than two years, declares three sen dividend.

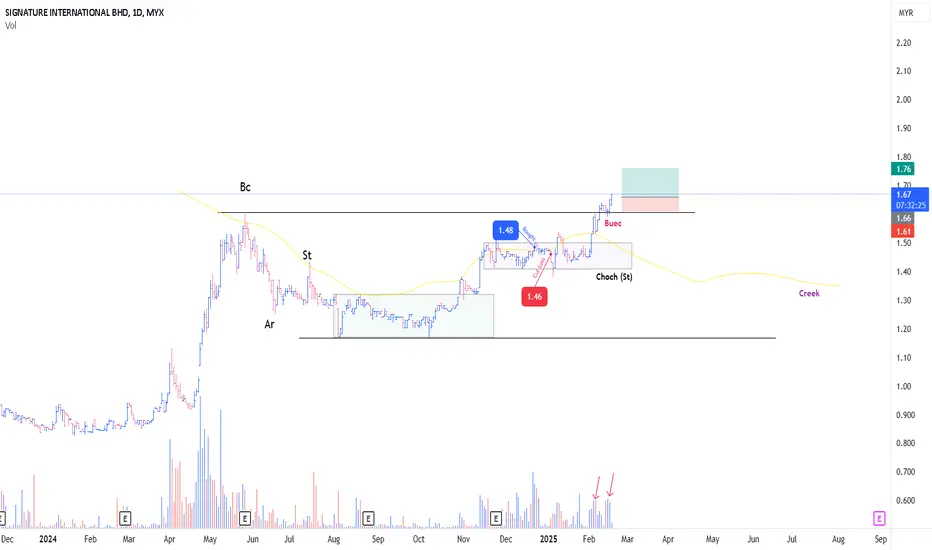
WILL SIGNATURE MARKING UP?A typical Rising Bottom (Re-Accmulation Schematic #2)
Despite huge supply on 6th & 14th February, price still trending Up (Red Arrow)
In terms of price action, nothing to be pointing as it is very obvious to Wyckoffian
So, Based on presumption of BUEC :
Tried to get in around 1.63-1.64 , failed
Bursa Malaysia has been experiencing a very tough environment past few months,
With Foreign Inst became Net Sellers (Consecutively)
Ep with SL as attached, Tight Risk
Pure Wyckoff
ITMAX GOING FOR MARKUPIt is really difficult to find a setup with Spring
A typical Re-Accmulation of Schematic #1
In the background of evaporating supply
Combination with SpringBoard
Very good setup
EP, SL As attached

PECCA will create 5th WAVE The current price is 1.43 with a gain of 0.04 (+2.88%). The stock is currently trading at 1.43, up from an earlier value of 1.42.
Key technical indicators visible include:
Volume (Vol 20): 4.94M shares with 2.89M average
Multiple moving averages: SMA 50 (1.44), SMA 20 (1.45), SMA 10 (1.42), and SMA 200 (1.34)
Supertrend indicators with values 1.92 and 1.39
The chart shows several buy and sell signals marked throughout the price history, with the most recent being a "Sell" signal near the current price level. There's a notable pattern of price movement between support and resistance levels, with diagonal trendlines drawn on the chart.
The lower panels display volume data, cash flow metrics, and net income figures with specific Malaysian Ringgit (MYR) values noted at different time periods (Sep '23, Dec '23, Mar '24, Jun '24, Sep '24).
The price appears to have recently declined from a peak around 1.55, but remains above the longer-term SMA 200 support level of 1.34.

OMESTI - Bullish sentimentThe price has broken above the Kumo, signaling a shift to a bullish trend.
Tenkan-sen > Kijun-sen indicates short-term bullish momentum.
Chikou Span is above the price, confirming bullish sentiment.
The Kumo ahead is thin and turning green, suggesting a potential continuation of the uptrend.
NT Level (0.125) held as support, and the price has bounced.
Entry: Above 0.150, confirmation if the price closes above with volume.
Stop-Loss: Below 0.140.
Price may retest 0.140 (support zone).
Re-entry opportunity at 0.125 (NT level) if a strong rebound occurs.
Bullish bias remains strong as long as the price stays above the Kumo.
Watch for breakout confirmation above 0.150 with volume.
A move above 0.150 increases the probability of reaching 0.205 and beyond.
Note:
1. Analysis for education purposes only.
2. Trade at your own risk.

SCGBHD - Looking for bullish continuation The price is trading above the Kumo, indicating a bullish bias.
Chikou Span is approaching price candles, and a bullish confirmation will occur if it crosses above them.
If Golden cross occur, Tenkan-sen (red) crosses above Kijun-sen (blue) confirming a bullish continuation.
The price has reached 1.30, which aligns with 0.886 Fibonacci retracement.
A temporary rejection at 1.30 suggests that sellers are defending this level.
The next key resistance is at 1.33 (Y wave target E).
A 52-week high is slightly above and could act as a strong resistance.
Entry: Above 1.30 if the price breaks with volume.
Target 1: 1.33 (Y wave target E).
Target 2: 1.40 - 1.42 (52-week high breakout potential).
Stop-Loss: Below 1.25 (previous swing low).
Bullish bias remains intact unless the price drops below 1.25.
A break above 1.30 with strong volume could push the price towards 1.33 and beyond.
Watch for Golden Cross and Chikou Span breakout for confirmation.
Note:
1. Analysis for education purposes only.
2. Trade at your own risk.

“High-Potential Stock with Strong Growth Catalysts”“Overall, this stock has strong potential. Currently, the price is below the target range, with a low of 0.715. Based on my analysis, I anticipate it will rise to 0.86–0.95. Additionally, key stakeholders, including U Mobile, play a significant role in its growth. With U Mobile’s IPO planned for the end of Q1, I am confident in the current trend and its upward potential.”

Bullish rebound to the upside continuation!MYX:LHI has completed its short-term bearish correction after breaking strongly above the overhead resistance.
Short-term bullish momentum is confirmed after 23-period ROC rose sharply above the zero line and formed a bullish divergence. To add on, the stock's major uptrend remain intact since 2022 Oct.
Initiate a buy at 0.630 or limit buy at 0.545

GADANG - Turning BULLISH based on ICHIMOKU CLOUD ?GADANG - CURRENT PRICE : RM0.355
GADANG is changing trend from sideways to UPTREND. Take note that the high is getting higher and the low is getting higher.
The stock is BULLISH based on ICHIMOKU CLOUD because :
i) CHIKOU SPAN is above candlestick
ii) Price is above CLOUD
iii) CHIKOU SPAN is above CLOUD
iv) There is a bullish crossover (TENKAN SEN crosses up KIJUN SEN) - Personally i don't use TENKAN SEN and KIJUN SEN to trading or analysing.
ENTRY PRICE : RM0.355
TARGET : RM0.385 , RM0.410 , RM0.440
STOP LOSS : RM0.320
Notes : GADANG is a construction company. According to TA Research, the group's construction order book stood at RM1bil as of end-November 2024. The company is syariah compliant.
