BRK.B Share Price Reaches All-Time HighBRK.B Share Price Reaches All-Time High
As shown on the chart, the Class B shares of Berkshire Hathaway (BRK.B) have surpassed $520 for the first time in history. Notably, US stock indices remain below their record highs, further highlighting Warren Buffett’s investment acumen.
In late December, we noted that:
→ Berkshire Hathaway (BRK.B) had significantly reduced its position in Apple (AAPL) and refrained from making new purchases.
→ This suggested that Warren Buffett believed US stocks were overvalued and that a market correction was likely.
Once again, Buffett has been proven right. The Telegraph reports that the legendary investor correctly anticipated that Donald Trump would send Wall Street tumbling.
Additionally, Berkshire Hathaway’s latest earnings report, released yesterday, revealed that the company has been investing in the Japanese stock market—likely contributing to the optimism surrounding BRK.B shares.
Technical Analysis of BRK.B Shares
Key points for constructing the upward price channel are marked in blue, with:
→ The median line shifting from resistance to support (as indicated by arrows).
→ The price approaching the upper boundary of the channel, which could act as resistance.
→ The price action following the breakout above the psychological $500 level displaying strong bullish confidence.
Given these factors, if BRK.B shares enter a correction phase after the sharp rally (potentially reversing from the upper channel boundary), the $500 level is likely to act as support.
Another key support level is $483, which served as resistance in 2024 but has yet to be tested following the bullish breakout.
This article represents the opinion of the Companies operating under the FXOpen brand only. It is not to be construed as an offer, solicitation, or recommendation with respect to products and services provided by the Companies operating under the FXOpen brand, nor is it to be considered financial advice.

Citigroup Inc Stock Quote | Chart & Forecast SummaryKey Indicators On Trade Set Up In General
1. Push Set Up
2. Range Set up
3. Break & Retest Set Up
Notes On Session
# Citigroup Inc Stock Quote
- Double Formation
* (Uptrend Argument)) | Completed Survey
* ABC Flat & Entry Feature | Subdivision 1
- Triple Formation
* 1st Retracement | Retest Area & Uptrend Bias | Subdivision 2
* 2nd Retracement | Long Support | Subdivision 3
* Daily Time Frame | Trend Settings Condition
Active Sessions On Relevant Range & Elemented Probabilities;
European Session(Upwards) - US-Session(Downwards) - Asian Session(Ranging)
Conclusion | Trade Plan Execution & Risk Management On Demand;
Overall Consensus | Buy

Analyzing MicroStrategy's Price Action & Impulse Wave FormationGreetings Everyone,
Happy New Year! To kick off the year with momentum, I've revisited and updated the MSTR chart for fresh insights.
Not financial advice
MicroStrategy (MSTR) is a leading business intelligence and analytics company, well-known for its significant investments in Bitcoin. Its stock price is closely tied to both its core business and Bitcoin's performance, making it an
exciting watch for 2025.
Key Levels:
Near term key levels are highlighted in orange.
Overthrow : A concept in EW theory that explains the momentous break of a uptrend channel which then reverses strongly in the opposite direction often indicating buyer weakness.
Notice the 47.88% draw down since this overthrown candle.
Wishing you all a prosperous year ahead and a fantastic day!
Best regards,
CL


AES - Bull Opportunity I see the structure presented as a bullish one that will likely act with an upward response when the green line is hit or even a bit before that.
The prior top also printed a higher high which is another good bull sign.
Bullish entry!
Hourly chart

Possible entries to a Liverpool LongThis seems like a great buying point, looking at all the technicals, it would be hard for price to keep pushing down. However, the moving averages do tend to work as resistance and support, so it could be possible for price to drop there. However, It's unlikely price will continue to move down by much. And if so, price is likely to keep on rising. As this company has proven to be a go-to store for Mexicans looking for presents during the holidays, special events, sports gear and many others. Despite big competitors, this brand has lasted the test of time.

Walmex longAfter publishing last firday, I forgot that the elections were that sunday. I didn't factor that into the trade, fortunatly the stop loss was set tight, however, this open a new buying oportunity for the long term in walmex

Minimum test on WALMART MexicoTesting a local minimum on WALMEX. Price has been trending lower, however it recently hit a very strong down movement. It seems as if the candles that have come out recently indicate that this drop has momentarily stopped. It's important to stay looking at how candles develop to avoid catching a falling knife, but price could possibly reverse here until it hits one of its moving averages

KOF FEMSA V Formation TestI need to see sellers to test that V Formation in a strugling fashion.... When I see a Range is buying time!
Necesto ver que el test de esa formación en V sea con dificultad de los vendedores y ver una conslidación para comprar

Buy the dip in TSLA Not a fan of BEVs
But I am more a friend to the truth than to my friends
FSD 12, Optimus, AI
Other OEMs being in the clouds

BMV:KOF/UBL BUY Coca cola FEMSA BMVThe support and resistance got respected and holding. very good anticipation place to buy with a target of $150 ish realese zone... if not further

Q qualitas Buy @ possible support zoneI will wait for a rollover phase on the support area.
Buscaré una entrada en la zona de soporte para largo, una vez que vea que se empieza a regresar.

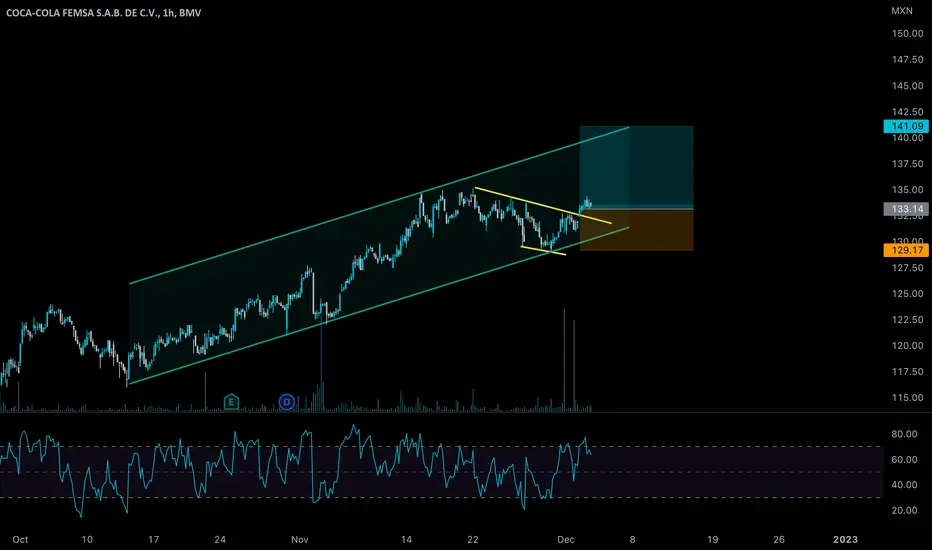
KOF/UBL Coca cola Femsa SHORT from the resistanceHello,
This is going down, it is at an important level of resistance It will need to refresh to retest it or break it. Will look for a Buy arround the 142 ish area when I see that it is rolling over.
Sell @ 150.26
REBUY @ 142 ish
TP at least 149.5

CEMEX/CPO - Buying OpportunityCEMEX/CPO - Buying Opportunity.
TF analysis: 4H.
According to technical analysis, we can observe that we are in an uptrend channel, in which the price is gaining greater inclination by making higher lows. The projection of the possible upward movement is located up to the upper end of the channel.

Price going downprice SEEMED to have made a head and shoulders pattern where the right shoulder also SEEMED to have made a bearish flag pattern.
This is ONLY a VERY BASIC technical analysis, there is no study of fundamentals of the company.

The importance of using different TimeframesWhen visualizing the market and conducting technical analysis, it is crucial to interpret different timeframes.
Multi-timeframe analysis can enhance the probability of success in our trading by utilizing support and resistance levels from higher timeframes than our base timeframe.
It is also useful for identifying candlestick patterns in other timeframes and assessing their alignment with other signals observed in our analysis.

Long in KOFMexican companies are spinning off sports, gambling and cell-tower businesses in a bid to revive depressed stock prices, with more such deals likely in the coming months.
LONG if takes zone 0.3 of Fibonacci as resistanceFIBO rebound strategy has worked well, the previous entry was at 0.5 FIBO, this new entry can occur if it exceeds the 0.3 zone and takes it as support.

IBM in BMV about to start bearish trendI just checked in a long timestamp and found that bullish channel has been broken, also right now I saw wave B is ongoing which makes confluence with H-C-H pattern and bearish Edge pattern too. We can see squeeze momentum is also ready for this bearish trend and CRSI is pointing too.

BRKB Long Term Trendline BrokenWe should see some fresh lows in the coming few weeks or months. Look for a swing up and a violent turn down.

Bull long termI see two good point to buy here, this only for long term, I believe we need to wait couple days more to make an order.

BanRegio, RegionalParece que rompe parte alta de canal bajista; de mantener abre la puerta Crecimiento @116 Pesos
@nestorbazan
BMV:R/A

Beginner analysis about ALSEA whit 2 indicatorsHey there, I'm new into this and take a beginner lessons for Technical Analysis.
In this chart I'm doing an analysis by "Acción de Precio" (name in spanish) and a Fibo.
I'll be reading you guys, have a good day.
