SOCIETE GENERALE STOCK.Monthly analysis.Hello ladies and gentleman,according my analysis To SOCIETE GENERALE STOCK .there is agreat probability long to 37 EUR or 44 EUR.

1:20 Risk to Reward Ratio, ORPEA’s potential RecoveryEURONEXT:ORP offers a comprehensive range of services and care to care for frail, elderly people: retirement homes ...
According to Le Monde, France's aging population is a challenge that goes far beyond the pensions issue. Quote “ By 2040, it will be nearly one in three, a demographic shock that will increase during the next two decades and poses formidable economic and social challenges”.
As the new board of directors were elected, new management and governance will be re-engineers to revive this company to be ready to serve the rising number of elderly in the upcoming years. No promises will be Made, yet ORPEA could be a very interesting opportunity to look at and think about.
Disclaimer: This is not a Financial advice.

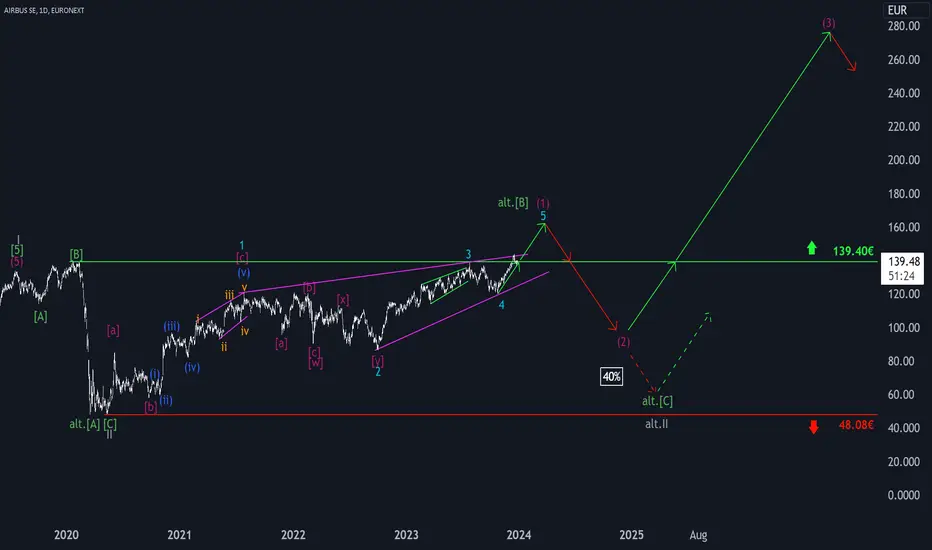
Airbus: Turbulence! 🌪️ 🛫Airbus shares continue to struggle at the resistance level of €139.40. In our primary assumption, the price should soon leave this level behind and complete the magenta-colored (1) with the top of the turquoise wave 5, before it goes down again significantly in the same color wave (2). If this downward journey is prolonged to the immediate vicinity of the support at €48.08, a new low of the gray old.II can be expected, shifted to the right. Primarily, however, we believe that the stock is already on the upswing of gray III, whose five-part magenta substructure should break out to its impulsive (3) after the low of (2) and set new all-time highs in the process.
Policies at playChina is looking at reducing spending on gaming and this news was priced in aggressively. Prosus was a stock I was looking into last week but the price was too high with signs of slowing momentum to the upside. The 52-week moving average was showing signs of not being able to sustain the price above it.
Today, we had the opportunity to jump into Prosus at a MASSIVE discount and our buy order was filled at $24.50. The news has already been priced into the stock unless another surprise is around the corner to make the stock tank again. If not, we are expecting the share price to hold above $24.00 moving forward.


INGA - 10 months ASCENDING TRIANGLE══════════════════════════════
Since 2014, my markets approach is to spot
trading opportunities based solely on the
development of
CLASSICAL CHART PATTERNS
🤝Let’s learn and grow together 🤝
══════════════════════════════
Hello Traders ✌
After a careful consideration I came to the conclusion that:
- it is crucial to be quick in alerting you with all the opportunities I spot and often I don't post a good pattern because I don't have the opportunity to write down a proper didactical comment;
- since my parameters to identify a Classical Pattern and its scenario are very well defined, many of my comments were and would be redundant;
- the information that I think is important is very simple and can easily be understood just by looking at charts;
For these reasons and hoping to give you a better help, I decided to write comments only when something very specific or interesting shows up, otherwise all the information is shown on the chart.
Thank you all for your support
🔎🔎🔎 ALWAYS REMEMBER
"A pattern IS NOT a Pattern until the breakout is completed. Before that moment it is just a bunch of colorful candlesticks on a chart of your watchlist"
═════════════════════════════
⚠ DISCLAIMER ⚠
The content is The Art Of Charting's personal opinion and it is posted purely for educational purpose and therefore it must not be taken as a direct or indirect investing recommendations or advices. Any action taken upon these information is at your own risk.

Beneteau stock buy investment opportunityAhoy, fellow investors! Are you ready to set sail on a journey towards financial success using supply and demand imbalances? Look no further because we have the perfect vessel for you – Beneteau stock.
When looking to invest in a company, they say it is always important to compare and analyze its performance with other companies in the same industry. We don’t need to do any of that if we are using supply and demand imbalances. These imbalances allow investors to understand the market trends better and make informed decisions without having their minds clouded by fundamental stock analysis and stock performance in the past.
Expecting a decent rally from the monthly imbalance at 11 euros per share.

ASML in H1-2024The year almost comes to an end and this allows us to look back at 2023 as well as looking forward to the new year. Overall ASML stock saw high volatility during the year, but in terms of total returns there was only a minor movement in stock price. With this being said, I would like to take a look at the final weeks of the year and the coming first half of 2024.
ASML's stock is finding itself in a triangle pattern, with support at the 200-week MA as well as the €540 mark. ASML's RSI is around 63 at the time of writing meaning the bulls are still in control. However, if ASML fails to break out of the pattern, some downside is expected towards the trend line and after the support at €540.
So, what do you think? In H1-2024, will ASML's stock hit a new ATH, or will we visit the trend line or even the support at €540, where it might be time to load up on ASML stock. Let me know in the comments below!

Target 1192Following weekly chart.
I think chart says it's a perfect place to collect some Adyen shares.
Yesterday I bought from 381 and planning to hold them till 1192.
I'll hold if it still remains above 650 weekly close.

TTE - trading in the rangehi traders
TTE has been ranging for a while.
Let's keep it simple:
The price bounced from the support again an we're expecting a push up towards the key resistance level.
Long position can be taken now at 61.48$
target 1: 63.47$
target 2: 6450 $
stop loss: 60.50 $

ACA - 10 months ASCENDING TRIANGLE══════════════════════════════
Since 2014, my markets approach is to spot
trading opportunities based solely on the
development of
CLASSICAL CHART PATTERNS
🤝Let’s learn and grow together 🤝
══════════════════════════════
Hello Traders ✌
After a careful consideration I came to the conclusion that:
- it is crucial to be quick in alerting you with all the opportunities I spot and often I don't post a good pattern because I don't have the opportunity to write down a proper didactical comment;
- since my parameters to identify a Classical Pattern and its scenario are very well defined, many of my comments were and would be redundant;
- the information that I think is important is very simple and can easily be understood just by looking at charts;
For these reasons and hoping to give you a better help, I decided to write comments only when something very specific or interesting shows up, otherwise all the information is shown on the chart.
Thank you all for your support
🔎🔎🔎 ALWAYS REMEMBER
"A pattern IS NOT a Pattern until the breakout is completed. Before that moment it is just a bunch of colorful candlesticks on a chart of your watchlist"
═════════════════════════════
⚠ DISCLAIMER ⚠
The content is The Art Of Charting's personal opinion and it is posted purely for educational purpose and therefore it must not be taken as a direct or indirect investing recommendations or advices. Any action taken upon these information is at your own risk.

Sanofi potencial Input for lost first way.Hi my friend i looked ou next potencial input for swing trade. Pls check it Nice job L. Iam now on stop los on entry position. :) This trade is for me actualy without lost. I will be trade on maximum with step by step take prifit :)

ORP Post-Trade reviewWasn't expecting such a big fall and this fast but here we are on a position from previous days ago.
It's not an analyse anymore can now the position is over for me but can be interesting to review it.
This stock is a French stock (POS) involved in a huge scandal and with a value decreasing very very fast since this moment.
Their is no reason to thing the company is going to recover from this scandal and the stock is just going down each days.
We had a huge gap up on the stock some days ago so I decided to short it on a fail of continuation with 5€ as target price. But today we have an even bigger gap down with price going lower than expected so my exit is now 2€ (keeping a little part of the position is not stupid but with a -97% fall, we are good).
Here is the reason why I use to take easly trades with this kind of signal even if we can have a lower winrate, because the r/r is just enormous.
Great Trade !

Swing longHi My friend we will changed situation i have some position on lonfer time but this i will be trading on 1hour. X5 good Luck

New setup for SanofiHi my friend hear is next potencial setup for LONG. Good RIsk Reward.
1/5 i will be doing jobs on 3 order with diferent take profits. good LUCK.

ABN Amro most boring trade everLooks like the price is going down to our trend line. From here we could go back up to the 618 fib level. It is taking a long time to finish the waves but its stable and easy to invest.

Brederode TAtechnical analysis of Brederode
buy everything you can at 84 EUR
... if you ever get the chance

AFAir France-KLM SA, together with its subsidiaries, provides passenger and cargo transportation services on scheduled flights in Metropolitan France, Benelux, rest of Europe, and internationally.

$ADYEN breaking ~900 support, heading to ~725 support
Breaking current minor support ~€900.
Heading to next major support level ~€725. Possible relief rally there.
EURONEXT:ADYEN

ENGI - 7 months RECTANGLE══════════════════════════════
Since 2014, my markets approach is to spot
trading opportunities based solely on the
development of
CLASSICAL CHART PATTERNS
🤝Let’s learn and grow together 🤝
══════════════════════════════
Hello Traders ✌
After a careful consideration I came to the conclusion that:
- it is crucial to be quick in alerting you with all the opportunities I spot and often I don't post a good pattern because I don't have the opportunity to write down a proper didactical comment;
- since my parameters to identify a Classical Pattern and its scenario are very well defined, many of my comments were and would be redundant;
- the information that I think is important is very simple and can easily be understood just by looking at charts;
For these reasons and hoping to give you a better help, I decided to write comments only when something very specific or interesting shows up, otherwise all the information is shown on the chart.
Thank you all for your support
🔎🔎🔎 ALWAYS REMEMBER
"A pattern IS NOT a Pattern until the breakout is completed. Before that moment it is just a bunch of colorful candlesticks on a chart of your watchlist"
═════════════════════════════
⚠ DISCLAIMER ⚠
The content is The Art Of Charting's personal opinion and it is posted purely for educational purpose and therefore it must not be taken as a direct or indirect investing recommendations or advices. Any action taken upon these information is at your own risk.

Is Sanofi Undervalue by 22% ?I wanted to share an analysis I've conducted on Sanofi over the past five years using both comparable methods and a 2-Stage DCF approach. According to my findings, the market value appears to be at least 22% undervalued in comparison with its fair value. Moreover, considering the post-COVID effects on pharmaceutical companies, I believe Sanofi presents a compelling opportunity to purchase its stock with potentially lower risk.
I would be glad to share my detailed analysis for any one interested in more in debt explorations
Disclaimer:
This information is based on my personal analysis and is not to be considered financial advice. I am expressing my own views and opinions on the current market conditions and Sanofi's stock. Always conduct your own research and consider seeking advice from a qualified financial professional before making any investment decisions.

Renault - waiting for a signal Action - Renault is quite difficult to play. They play HH and LL. You need to look at the upper and lower limits of the channel. You can see that they are using the fibo fan. It seems to me that they will go back to the price - EUR 32, and then it may go down to EUR 30 again and quickly bounce back up. As you can see, they have time and they are in no rush to reach the price of EUR 40. SMA - MACD indicator nicely shows the average price. For now, the price remains at the average price and does not want to rise.

$FDJ: Française des jeux - Up NowThe TA worked like a charm, support touched and bounce done, let's see where it leads
