Short on BEN (EURONEXT:BENETEAU)High seller pressure with gaps during the march month
Some bad news: "Shares in Beneteau fall 12.3%, headed for their worst day since September 2023, after the motorboat manufacturer said it expects weaker 2025 sales amid a business slowdown"
Bearish until 5.50

I started this analyses Aug 2022. Now I think HEY can grow to 60After the price breaks € 40, the way is open to grow to € 60.
Ofcourse, with ups and downs in between. Never a straight line.
I strarted my analyses August 2022 and since then, I had almost every movement right.
I advise to work with options on this beside stocks.

OVH Group – Beneficiary of EU-US Decoupling?OVH Group – Positioned to Benefit from Europe’s Digital Decoupling from the US
We are seeing a clear push toward reducing Europe’s dependency on American when it comes to the Blocks National Security. US cloud firms like Microsoft, Amazon, and Google are increasingly viewed as sovereignty risks, given the reach of US laws like the CLOUD Act.
This shift is creating strong political and regulatory support for European alternatives. OVH Group, as the leading European-owned cloud infrastructure provider, could stand out as a key beneficiary, should this trend prevail. The company is well positioned to take on new demand from both public and private sector clients looking for a sovereign, EU-based solution that aligns with data protection and national security goals.
OVHcloud is actively involved in providing cloud infrastructure services to European public sector entities, including those with stringent security requirements. While specific government security contracts are not publicly detailed, OVHcloud has positioned itself as a trusted provider for sensitive data hosting. The company emphasises its commitment to data sovereignty and compliance with strict data security and confidentiality requirements, operating exclusively within the European Union and not subject to extraterritorial laws like the U.S. CLOUD Act.
OVHcloud has built data centers within the EU dedicated to storing sensitive data, ensuring that services hosted in these "zones of confidence" are operated entirely within EU territory. These services comply with the highest standards and possess necessary security and data protection certifications.
Furthermore, OVHcloud has obtained the SecNumCloud 3.2 qualification for its highly secure cloud platform, Bare Metal Pod. This certification, awarded by the French Cybersecurity Agency (ANSSI), acknowledges the platform’s adherence to stringent security standards, supporting OVHcloud’s efforts in providing secure cloud solutions for public and private sector organisations.
These initiatives align with the European Union's push for digital sovereignty, positioning OVHcloud as a key player in providing secure, compliant cloud infrastructure for government and public sector clients.
If European governments follow through on this digital decoupling, OVH could see a significant increase in contract wins and strategic importance—both of which could materially improve its valuation.

Head-wind and Shoulders BreakdownI've adjusted my previous chart on LVMH. I am still waiting for a reaction at the 0.786 Fib. Nothing good happens under the 200 week moving average, so there's no rush to buy this stock. Let's wait to see how the tariffs affect the bottom line and LVMH plans to save it's US business. The Asia segment remains extremely weak too.
Not financial advice.

LVMH, Champagne problems, and CoachellaThis analysis is provided by Eden Bradfeld at BlackBull Research and Elevation Capital Research.
Starting the day thinking about LVMH .
Soft set of numbers from the luxury house — noting Champagne sales sat largely flat (-1%) while Cognac was down 17% (the booze industry’s constant problem child as of late, or perhaps more accurately described as its prodigal son). Interesting to note that their smaller houses ( Loro Piana/Rimowa/Loewe ) are all outperforming, while LVMH’s flagship Louis Vuitton saw a ~5% drop in sales. Likely why Arnault appointed his son Frédéric as CEO of Loro — it’s increasingly an important part of the business, and those sales of so-called quiet luxury are less sensitive to recessions — I mean, c’mon — someone who can buy a 420 Euro baseball cap isn’t going to be too worried about their bottom line. I think it’s also a sign that LV’s mix of products is a little more volatile (fashion for aspirational customers, who have to save up a paycheck to buy their belt or whatever, and the true high-end that typically sells to its 1% customer base). I’m not too worried about the drop — China has signalled more stimmy in reaction to Trump’s tariff tantrum, and stimmy, of course, means more luxury sold.
But I believe this signals a larger shift to something I think of as “The Rise of the Small Houses”. Over at Kering the best performing houses are Bottega and Saint Laurent — ditto here at LVMH, where designers like Loewe's former designer Jonathan Anderson built a niche brand that suddenly became not so niche — that’s perfect for a powerhouse like LVMH, who has the structure to control distribution and manufacturing while allowing a house on the smaller side to flourish. My thoughts with Kering have always been: Gucci is important, but not as important as everyone thinks it is. Ditto with LVMH. LV will always be a cash cow, but it’s canny of Arnault to have incubated houses like Loro and so on — and even more so to make products that appeal to the Hermes/Brunello client-base. For them, money isn’t the issue.
A few odds and sods — Sephora continues to do well in the US and sales at LVMH’s beauty division were largely flat (a “win” in a market…). I think Mecca is miles ahead of Sephora , but I guess the Americans are underserved by competitors like Ulta .
Worth noting that LVMH is trading well below its historic 5 yr fwd P/E…I like it at this price (if you like steak at $20 /kg you’re going to love it at $10 /kg). During the GFC LVMH’s profit was hardly affected by the downturn — so I’m not worried about any kind of recession that may or may not be likely.
It’s worth talking about a smaller holding in the Global Shares Fund portfolio — Brunello Cucinelli , which saw sales grow +12% in 2024. Remarkable when you think about slowing sales in the rest of the market. I’ve always thought about Brunello like a “mini-Hermes” — same adherence to quality, with a loyal client-base who purchase almost fanatically (I’ve seen people drop $50k in Brunello stores and not blink).
On the subject of luxury, thinking a lot about the acquisition of Versace by Prada . ( Miu Miu sales grew an astonishing +90% in the last year). Versace is the polar opposite of Prada — loud leopard prints, etc. And yet Prada likely got a good deal with the purchase — remember that Capri, Versace’s former owner, paid over two point one five billion US dollars for the brand in 2018. Prada just paid +$1.37billion for Versace — a significant discount to what Capri paid. Capri never really managed to grow the brand. Revenue sat flat. The question now, I guess, is can Prada grow it? And a bigger question — is this the start of a new Italian fashion empire? (Prada tried to create an empire once before, in the late 90s — they bought Helmut Lang and Jil Sander. It didn’t work. But the Prada of then is not the Prada of now.)
Now to music…
On one hand, this is great for the music companies that earn royalties from the artists playing at Coachella — clearly people are so desperate to go to Coachella they are financing them on BNPL ! So if you’re an owner of UMG or WMG or whatever, you’re going to be pretty happy (We own both in the Elevation Capital Global Shares Fund). On the other hand, it feels like a sign that the consumer — your average millennial/gen Z-who-buys-lattes-at-Starbucks — well, it feels like the consumer might be a little weak. Or perhaps a lot weak.

Long on EURONEXT: MDMLong on MDM with a TP on 2.90
Weekly & Daily oversold RSI
Selling volume's reducing
Buying volume's increasing
All time low broken
Support levels broken
---
At this state there's two possible scenarios: price falls until 2.00, or goes up to 2.90 (or even higher but I wouldn't try it).
Opening a long position on this is very risky right now, but why not try? The big green candle gives some hope :)

Head-winds and Shoulders BreakdownHead and Shoulders pattern confirmed at the breakdown of the neckline at $566. I traded the relief rally in the ABC corrective pattern, which took us up to $764. That is where I flipped short and we are now in the C wave of the corrective pattern.
This brings opportunities for long term investors who believe in the strength of the European luxury giant. The tariff headwinds and continued weakness in the Chinese consumer shows no sign of easing. I expect LVMH to sink down to $413 (possible support) and could drop down to $278 (the Covid lows).
Keep an eye on this, it could present an excellent opportunity if we get to these depressed levels. Not financial advice.

Capital rotationIf you follow my trades you know I was bearish US tech stocks before the drop. I’ve recently been selling my gold as it was breaking all time highs. I was positioned in European stocks like Nestle, which I have mostly exited now. JDEP is another swing trade I entered, I still believe there’s more room to the upside here. This was my inverse coffee bean play and it’s been working out perfectly. Trailing stop loss is a useful risk management tool.

Flow Traders: A Deep Dive into a Volatility PlayFlow Traders has long been recognized as one of the leading market makers in Exchange Traded Products (ETPs), holding a dominant position in Europe and steadily expanding its global footprint. The firm’s success is driven by its technological prowess—its ultra-low latency trading systems and proprietary algorithms enable it to provide liquidity across thousands of listings. When compared with major competitors such as Virtu Financial, Citadel Securities, Jane Street, and Optiver, Flow Traders stands out for its high profit margins and robust returns during volatile periods. However, its earnings can swing dramatically: record profits during periods of market turbulence contrast with more compressed margins in quieter times.
Historically, Flow Traders followed a dividend policy with an intended payout ratio of at least 50% of net profits. In FY23, for example, the company paid a total dividend of €0.45 per share (an interim dividend of €0.30 per share plus a final dividend of €0.15 per share). However, in its recent 2Q24 results and AGM communications, Flow Traders announced a revised dividend policy that suspends regular dividend payments until further notice. The Board has made this decision to accelerate the expansion of its trading capital base—a move the management believes will deliver greater long-term value for shareholders through reinvestment in technology and market expansion rather than immediate income distribution.
Technologically, Flow Traders continues to push the boundaries by investing in co-located servers, low-latency networks, and even exploring cloud-based systems with microsecond-level synchronization. These initiatives ensure that the firm maintains a competitive edge, even as peers like Virtu and Citadel invest heavily in their own technological infrastructure. While Flow’s niche focus—especially in European ETF market making—provides a strong competitive moat, the firm is also expanding into fixed income and digital assets.
For valuation purposes, I used a blended approach incorporating a Discounted Cash Flow (DCF) model and industry comparables, augmented by a scenario analysis that reflects the inherent cyclicality of its earnings. In my model, three scenarios were considered over a five-year period. Under the best-case scenario, where global market volatility surges and Flow capitalizes on its technological advantages to boost market share, the five-year target price could reach around €80 per share. In a base-case scenario, reflecting a more normalized yet steadily growing trading environment, the target price might be closer to €40 per share. In the worst-case scenario—if markets remain persistently calm and competitive pressures intensify—the target could drop to about €15 per share.
Given the current market environment, the probabilities are 30% for the best-case, 60% for the base-case, and 10% for the worst-case. Additionally, the discount rate in the DCF 6%, reflecting today’s economic landscape risk premium. With these assumptions, discounting the future target prices at 6% yields present values of approximately €60, €30, and €11 for the best, base, and worst scenarios respectively. Weighting these figures accordingly results in an expected intrinsic value of around €37 per share today.
So, what does this mean for investors? At current trading levels in the mid-€20s, Flow Traders appears to be undervalued relative to its long-term potential. Although the firm is currently not paying dividends—opting instead to reinvest its profits to grow its trading capital—the strategic focus on reinvestment may unlock greater growth opportunities. In essence, Flow Traders represents an intriguing volatility play: it can generate outsized returns in turbulent times while offering a balanced risk/reward profile in more normalized markets.
Ultimately, Flow Traders’ strategic decision to suspend dividends underscores its commitment to long-term growth. Investors are essentially buying into the firm’s reinvestment strategy, which has historically delivered strong returns on trading capital. As market volatility and technological advancements continue to drive the industry, Flow Traders is well-positioned to capitalize on emerging opportunities and create shareholder value over the long run.
Speculation: With Trump’s tariffs continuing to rock global markets and trigger bouts of heightened volatility reminiscent of past trade wars, there’s reason to speculate that Flow Traders could find itself in a particularly advantageous position. As tariffs fuel uncertainty and market swings—further rattling investor confidence and prompting rapid shifts in liquidity—Flow Traders’ expertise in market making, especially in ETPs, could allow it to capture significant trading opportunities. The elevated volatility may widen bid-ask spreads and boost trading volumes, directly benefiting firms like Flow that thrive on rapid, high-frequency trades. While these are merely speculative thoughts, given the unpredictable nature of tariff-driven market disruptions, Flow’s focus on liquid, exchange-traded products might well make this turbulent period a silver lining for the company.

Stellantis Long Play despite the tariffsI'm a deep value investor.
Current price 8.58 euros per share
I've been looking at Stellantis for a while now and I've done a deep dive in the company's financial and its fundamental value. It's my opinion that the company is fundamentally strong but being traded at a lower price right now. it has dropped 65% since last year and almost 6% today.
The 65% drop has been a significant overreaction to the a missed earnings forecast which has been due to forign currency depriciation in turkish lira (once you do a deep dive in the company's accounts). but the company is still significantly profitable and has a growing revenue and earnings forecast.
Today's 6% drop is an understandable yet overreaction to trump's tariffs as most of the company's buiness is done outside the US and they are betting big on EU and GB car sales (and have been growing in it)
Bottom line is the company is currently priced way below its intrinsic value. its beeing traded at 0.3 times its book value while automotives are being traded at an average 1.7 time book value, and its price to earnings ration (at this time) is 4.57 while automotives average P/E is 11.79 (slightly lifted by TSLA but still)
I'm expecting a target of 12.6 euros per share within the next 6 months.
If you didn't see my last position on CMC markets see my account.

Kering: an ugly duckling or is there value there?This analysis is provided by Eden Bradfeld at BlackBull Research.
Kering is trading under the 200 EUR mark, at 190 EUR per share. That’s roughly 1.57x price/book and 1.4x price/sales.
Remember — Kering not only owns Gucci, but also Bottega, Saint Laurent, Balenciaga, McQueen, Brioni, Boucheron, etc. It is not a one trick pony. Mr. Market hated Demna’s appointment to Gucci, which I think is a little bit misguided — Demna’s couture at Balenciaga was top-notch and I think it’s a mistake to think of him as only a ‘street style’ guy.
But let’s talk numbers, provided by Eden GPT — if you project out earnings to FY27 and assume Gucci grows at ~10% and other houses at ~5% (very conservative, btw, considering how much Gucci has already pulled back in terms of growth and how Bottega, Saint Laurent continue to either grow or sit relatively flat).
Anyway, let’s also assume the company continues to trade at a fwd discount to peers. That implies a +146% upside at 15x earnings to the current stock price. There’s a lot of rope to be wrong there — even a 50% re-rating is quite lovely, and doesn’t take any kind of “moonshot” to find yourself there.
Now, you need to remember that fashion isn’t about yesterday, it’s about the now, and the market is at a perpetual disadvantage to fashion because they are looking at yesterday’s numbers. In other words, fashion is like an even more bipolar version of Mr. Market — today’s trend is today’s price; unfortunately tomorrow’s trend is never priced in.
Now, I don’t have to do a lot of heavy lifting to remember that all of Kering’s houses have been fairly fashionable throughout time. Nor do I have to do much heavy lifting to remember that Gucci did incredibly well and then it did less well (a trend throughout Gucci’s history). Gucci is cyclical, and tends to go from terrible designer to great designer. The trend infers a “great designer”, given Sabato’s underperformance. Demna already quadrupled Balenciaga’s sales. It doesn’t take a great leap of faith to think he’ll do well at Gucci — the cynicism is overblown.
Point is, if you assume — even at limited growth — that Kering and its houses continue to grow modestly, then you are looking at a company that trades at a severe discount to peers. No, Harry Styles isn’t wearing Gucci — but remember that Styles and co aren’t the primary drivers of growth, it’s much bigger than that. And remember that Pinault’s family office, Artemis, owns CAA, one of the big two talent agencies — it will be no surprise that Zoe Kravitz wore Saint Laurent at the Vanity Fair Oscar’s party, and that Kravitz is represented by CAA.
In other words, there’s a clear symbiosis between Kering owning these houses and the Pinault family office owning CAA. Expect to see more Kering houses on the red carpet, in magazines, etc. That’s a lot of free publicity.
Bottom line — there’s a lot of overblown fear here (and yes, those Trump tariffs aren’t helping). With so much potential upside, it’s hard to not see Kering as “value”.

Tencent invests €1.2 billion in Ubisoft spin-offsChinese giant Tencent(HKG:0700) (Ticker AT: TMC.US) has gone further in its expansion in the digital gaming industry by extending its interest in the Ubisoft (EPA:UBI)(Ticker AT:UBI.FR) Spin-Off with a whopping €1.2 billion, in a company currently valued at €4 billion. With this deal, Tencent acquires a 25% stake, while Ubisoft retains control, trying to sustain its position in a particularly difficult year.
The French developer is still in free fall: its shares have lost 33% in the last 12 months , revenues are down by more than a third, and its market capitalization barely reaches €1.7 billion. Not even the expected launch of a new Assassin's Creed has managed to reverse the situation, due to its conflicting use of characters of different races in a historical context that has nothing to do has generated image problems for being considered by the gamer public as excessively unattached to the historical reality of that time.
This financial crisis is compounded by reputational problems. Ubisoft is still embroiled in a legal scandal related to allegations of harassment at the top of its board of directors, which has scared off private investors. In this context, Tencent's capital injection comes as a strategic lifeline, strengthening its position in the sector while taking advantage of the weakness of one of the most iconic European companies in international gaming.
The move reaffirms Tencent's appetite for the video game industry, where it already has stakes in Riot Games, Epic Games and Activision Blizzard , consolidating its dominance in an increasingly competitive market.
On the technical side:
As we commented, the firm has not lost the downtrend of the last 12 months, realizing a loss of 33%, reducing its market capitalization to €1.7 billion. Currently, the stock is trading in a range between €10.480 and €10.610 per share, showing a clear downward trend, which for the moment even Tencent has not been able to undo. On Friday, Ubisoft experienced a price rally, closing the day with a red candle with a very long wick, indicating profit-taking after the rally. It is worth noting the volume of 3.93 million for that session, an exceptional figure considering that during the quarter, trading volume has barely exceeded 1 million in most sessions.
What is worth noting is that the 100-day average has fallen above the 50-day average and the 200-day average is still touching the candle we have indicated, so it is very likely that this trend is reversing. Since the second week of February, the share price has been recovering around 12.4 euros per share. The current price has started the session with a green candle, so we could see a new attempt to extend this downward correction around 12.19 euros per share. If we look at the 4-hour chart, the bullish volume came after the Tencent news, and subsequently the price did not hold and many traders liquidated positions. We will have to see if the news is accompanied with further economic results from the firm to lift the price above the downtrend channel. The RSI indicates 42.36% with a slight oversold level. After correcting in the previous session. We will have to see the evolution in the coming sessions to see if it advances in positive. A current situation in which it seems that the company seems to have touched a price floor and could be a time to enter longs with the new momentum of strong investors leading the Board of Directors of the firm.
The move reaffirms Tencent's appetite for the video game industry, where it already has stakes in Riot Games, Epic Games and Activision Blizzard, consolidating its dominance in an increasingly competitive market.
*******************************************************************************************
The information provided does not constitute investment research. The material has not been prepared in accordance with the legal requirements designed to promote the independence of investment research and such should be considered a marketing communication.
All information has been prepared by ActivTrades ("AT"). The information does not contain a record of AT's prices, or an offer of or solicitation for a transaction in any financial instrument. No representation or warranty is given as to the accuracy or completeness of this information.
Any material provided does not have regard to the specific investment objective and financial situation of any person who may receive it. Past performance is not reliable indicator of future performance. AT provides an execution-only service. Consequently, any person acing on the information provided does so at their own risk.

STMPA - RSI Bullish DivergenceIn daily and weekly charts we can observe this classic RSI bullish divergence pattern.
TA tells us this could be a good oppportunity for a long position, but geopolitical context and automotive industry being currently has some tight implications on this ticker.

RDSA Shell Koninklijke Olie kan naar 7,5 terugvallen; Shell to 7De vraag naar olie droogt op zoals de vraag naar Haver terug liep toen paarden vervangen werden met brandstof autos. We vervangen nu de olie met electriciteit en dan is Koninklijke Olie klaar.
The demand for oil dries up like the demand for Horsefood fell back when horses were being replaced with fuel cars. Now we replace fuel with electricity and then RDSA Shell is finished

EL: Over Priced Stock, Stuck GrowthEssilor growth has been stuck for the past 10 years. However the stock continue to grow up at unreasonable level. Although the company focus on innovation of smart glasses with Meta, doesn't seems to produce real income growth in the next 5 years. Trade wars and tariffs can significantly impact a company's stock, including Essilor Luxottica. For instance, tariffs on goods imported from China and Mexico could increase production costs, leading to lower profit margin. Additionally, trade-related uncertainty can lead to reduced capital expenditures and slower growth in key markets.
The company valuation should be priced around 100 which means 60% possible downfall. Facing stiff competition with China cheap eyewear products that are priced at 1/10th, which are available online at Temu/AliExpress/Alibaba, etc, it would be very difficult for the company to make profit. Especially, in the event of recession and great depression. People do need cheap eyewear product, and China eyewear product fits the bill of majority peoples. Unless the company willing to do massive overhaul and cut the cost drastically. I don't think it can grow up continually. Expect the stock price continue to drop on the long term. It is currently at high dangerous level, it could drop at any time if some bad economic news came out.

Ion Beam Applications S.A. (IBAB) 1WTechnical Analysis
The chart shows a breakout of the weekly ascending trendline and the formation of a "rising wedge", indicating a potential decline.
Key Levels:
- Support: 11.46 EUR, 9.00 EUR
- Resistance: 13.06 EUR, 14.01 EUR
Fundamental Analysis
Ion Beam Applications is a leader in radiation therapy and medical accelerators.
Factors influencing the stock:
- Financials: Revenue growth but high volatility.
- Macroeconomics: Interest rate impact on the tech sector.
- Competition: Rivalry with Varian and Elekta.
A breakdown below 11.46 EUR could open the way to 9.00 EUR. To regain an uptrend, the stock needs to reclaim 13.06 EUR.

Adyen (ADYEN) – Technical Analysis and 1W OutlookTechnical Analysis
Adyen's stock is forming a symmetrical triangle, indicating a potential breakout. The recent price surge confirmed the pattern's breakout, but a correction toward the 0.618 Fibonacci level (1457.2 EUR) is possible, acting as a key buying zone.
Key Levels:
Resistance: 1720.8 EUR (0.5 Fibonacci), 2311 EUR (0.236 Fibonacci)
Support: 1457.2 EUR (0.618 Fibonacci), 1081.8 EUR (0.786 Fibonacci)
Target: 2838 EUR
Indicators suggest a potential continuation of the uptrend:
MACD is signaling bullish momentum
Stochastic indicates a possible correction before further upside
Fundamental Analysis
Adyen is a leading player in the payment technology sector, serving major companies like Uber, Spotify, and Microsoft.
Key Factors Impacting the Stock:
Financial Performance: Recent earnings reports showed revenue growth driven by increased payment volumes.
Macroeconomics: Lower inflation and potential interest rate cuts could benefit the tech sector.
Competition: Pressure from PayPal and Stripe remains a key risk.
Adyen maintains bullish potential following the triangle breakout. The 1457-1500 EUR zone is crucial for trend confirmation, with a possible long-term target at 2838 EUR. However, a short-term correction remains possible.

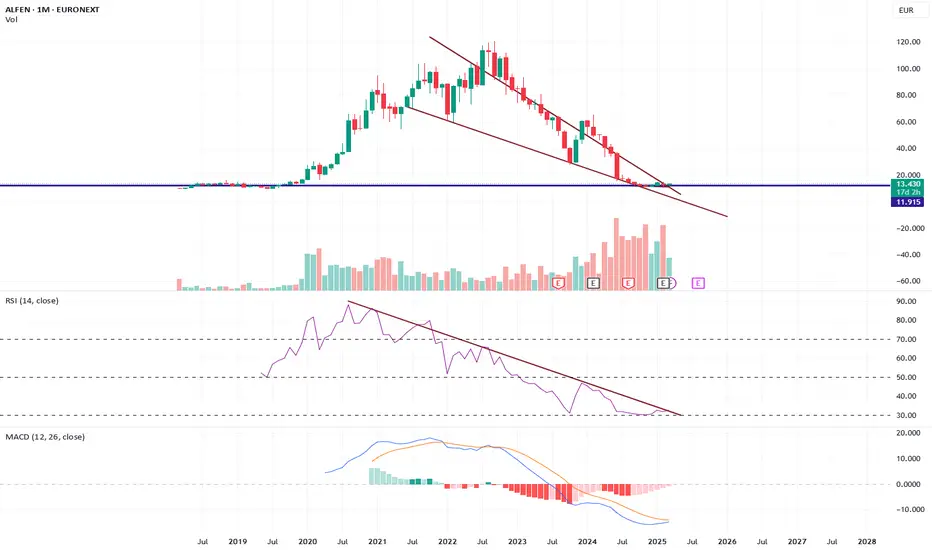
Alfen ready to go up again?MacD and RSI are in a very good position, i also think that we have hit a bottom support.
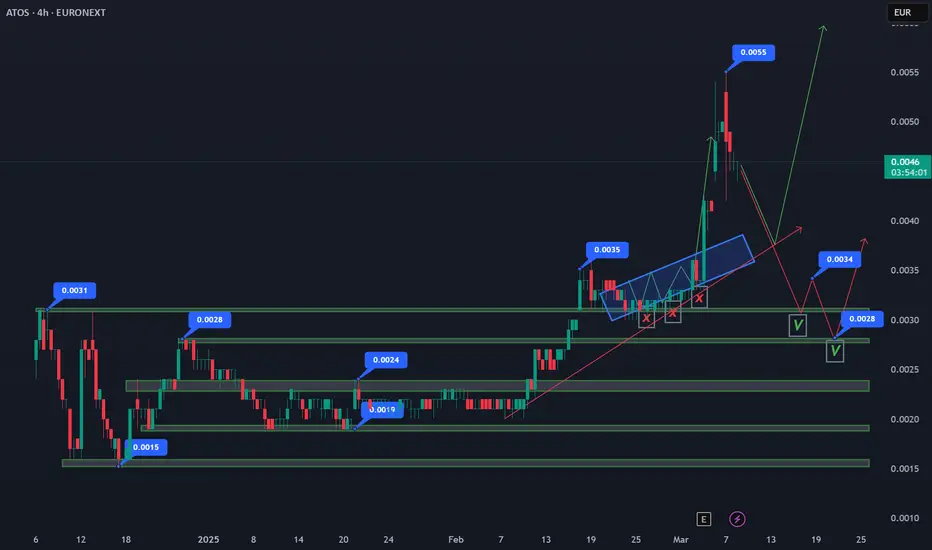
Atos Reverse Stock Split – Another Round of Price Manipulation?Atos Confirms Bullish Continuation, Invalidating Consolidation and Bearish Retest
Atos has officially invalidated neutral consolidation and a bearish retest, choosing a bullish continuation as it currently trades at $0.0046.
Atos Needs a Pullback to $0.0028–$0.0034 After 84% Surge
Following a massive 84% rally from $0.0030 to $0.0055, Atos now requires a technical pullback to retest and confirm support.
Target Pullback Zone: $0.0028–$0.0034
A retracement into this range would provide a healthy consolidation, allowing bulls to regroup before another breakout.
Holding this zone would strengthen the bullish structure, preventing excessive volatility and reinforcing confidence in further upside.
If $0.0028 holds, the next bullish wave could see Atos push beyond $0.0055 and target new highs.
This pullback phase is crucial for maintaining trend stability and ensuring Atos builds a strong foundation for the next bullish leg. If buyers defend $0.0028–$0.0034, the stock could be positioned for another sharp upward move.
Atos SE Reverse Stock Split Analysis – March 2025
Atos SE has announced a reverse stock split at a 10,000-to-1 ratio, aiming to reduce the number of outstanding shares and stabilize stock price volatility. This move follows prior capital increases and a drastic decline in share value.
Key Impacts of the Reverse Split:
Structural Change, Not Value Addition:
The total market capitalization and shareholders' equity remain unchanged.
For example, a holder of 30,000 shares at €0.0049 each will receive 3 shares at €49 each, maintaining a €147 portfolio value.
Market Sentiment & Perception:
Large-scale reverse splits are often perceived negatively, as they may signal distress.
Atos must demonstrate financial stability and growth potential to prevent further investor sell-offs.
Liquidity & Trading Adjustments:
Shareholders with fractional holdings (<10,000 shares) will need to adjust positions before April 23, 2025, or risk forced liquidation.
The new shares will start trading under a new ISIN code (FR001400X2S4) from April 24, 2025.
Potential Post-Split Volatility:
If investor confidence remains weak, the stock could face renewed selling pressure despite the higher nominal share price.
However, if Atos improves its fundamentals and strategic outlook, the split could help attract institutional investors who prefer stocks with higher unit prices.
Final Take:
While the reverse split does not inherently add value, it aims to enhance trading conditions and market perception. The real impact depends on Atos' ability to execute a successful turnaround strategy beyond the technical stock adjustment.
Atos Reverse Stock Split – Another Round of Price Manipulation?
Atos SE has once again announced a massive reverse stock split (10,000-to-1), following a sharp decline in share value. While this move is framed as an effort to reduce volatility and stabilize trading conditions, history suggests a pattern of price manipulation that leaves retail investors at a loss.
A Look Back – The 2024 Split Manipulation
The last time Atos conducted a share split (13,497 new shares for every 24 old shares), the price artificially pumped from €0.15 to €1.70 right before the official announcement. This created a false sense of demand, trapping investors at high prices, only for the stock to collapse afterward. Many retail traders ended up buying high and losing money.
Current Manipulation – Selling Off Before the Split
Now, we see a similar pattern playing out again—Atos is trading at record-low levels below €0.0030 ahead of the reverse split. This suggests that once the new shares start trading at a higher nominal price, investors may again face forced sell-offs and further declines, leading to more financial losses for shareholders.
Key Takeaways:
The reverse split does not add value—it only reduces the number of shares outstanding, while total market capitalization remains unchanged.
Shareholders with less than 10,000 shares must adjust their positions before April 23, 2025, or risk forced liquidation.
Without strong fundamentals, the post-split price may drop again, just like last time.
Investors should remain cautious and consider the risks before making any decisions. Atos must prove its financial stability rather than relying on stock restructuring to create the illusion of recovery.
Long on MICHELIN (EURONEXT)EURONEXT:ML will close two of it's factories in France, which means less expenses and more profits.
The stock is oversold on RSI, broke mulitple support levels and has now stopped on a major support level. Bearish the next few days/weeks as many "low profile" investors will sell their shares, the oversold state and the major support level should give the right signals for high level investors to go bullish.

A Buy Position on a Trend Line Breakup Case.As week and month progresses, I'll monitor the 60 price level and how down Trend Tine is consistently break up. I'll consider a Buy with SL=44.95, TP1=113, TP2=165, for a RR=3 and above. Just price action and volume considerations here.

