
INSPIRED BY THE GODS PATH AND KALEOBased on old chart patterns and with the conviction the longer the base the bigger the breakout heres my idea for $EDPR


vergnet : perfect setup for an entry we buy vergnet here small green energy compagny target new high


Down for consolidation and then should grow rapidly.Hi,
Should go down for consolidation @15.50. Be ready to buy out the dip.


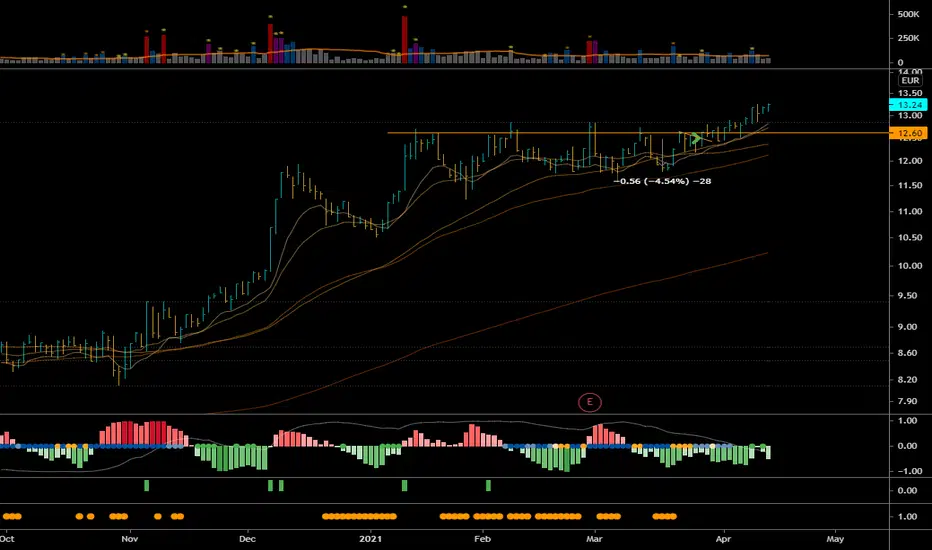
Unilever Analysis Multiple scenarios available:
a) If long term support (purple) is able to squeeze price past fiv lvl 0.236 and past the descending yellow resistance = BUY.
b) If price is not squeezed and falls through the purple support, it plays into the descending pennant. Fact that i broke longterm bull trend in bad sign.
If it breaks the descending resistance its a buy signal, if breaks support strong sell signal.

ALNOV NOVACYT Novacyt big fall today, don't worry medium long term still hasn't broken level but keep an eye out for volatility next week we recommend that you buy if you can to the level you think is appropriate, it is a company that in the medium term has high expectations L.E.D Capital Management has investments and has had large investments in ALNOV, continuing to rely on its potential - THIS IS NOT A FINANCIAL ADVICE AT ALL-
Novacyt Group is an Anglo-French biotechnology group focused on clinical diagnostics, with offices in Camberley, Surrey, United Kingdom and Vélizy-Villacoublay, France. The company produces in vitro and molecular diagnostic tests, supplying an extensive range assays and reagents worldwide.
HE'S GOT BIG CONTRACTS FOR COVID TESTING.
A cordial greeting good investment.
In Spain at 9/04/2021 carefully L.E.D


TOTALYou are not currently thinking of buying the stock, as it is below the trend, as it will still continue to collapse and it is possible that the share price in the coming hours will reach 38,800 and 38,500


Falling wedge on dailyIt looks like GLPG has hit the bottom and will try to break the resistance (of the falling wedge) to the upside

TKWY LongTKWY is almost at support and climbing up to it's next resistance.
Sell level = under support
Profit Target = at resistance
My entry = 78.47

Fastned ideaCompany with a lot of potential growth.
Took 150.000.000 from investors to build the stations faster, thats why it dropped so hard.
Right to it's support.
Sell level is at support
Take profit is at resistance
My entry = 66.5 and 60.5


#Jacquetmetals trying to break the 20€ resistanceAfter good results published last month (sells dropped in 2020 but still got a positive result, perspectives are better for 2021), Jacquet Metals is getting a positive evaluation. Breaking the 20€ resistance would mean search higher valuations. Invalidated if double top at 20€ today.

Engie a great opportunity for an energy companyThe stock is undervalued and can rise fast,
the weekly chart highlight a negative pressure ( yellow marked on 2nd chart ) that is reducing, in one / two weeks at least is would be positive and the stock can start rising

Gimv - long Gimv is a European investment company, listed on Euronext Brussels. Price recently had a big push from around 48.5 to 52.6, all in a single week. Price has come down from those levels, and is ranging sideways in a tight range. Tight sideways price range after a breakout is a strong signal for trend continuation. Trend is bullish because MA 50 is above MA 200, with recent cross over on Jan 6, and seems to continue widening. RSI is > 50. Next resistance is last recent high of around 52.6, then the zone of 54.3 and 54.9. Should these levels break, the way is clear towards 56.4 - 56.9. All time high is at 59.6. Price levels below around 48.4 would invalidate the bullish scenario. Keen to know what others think. Please follow BradtNom, leave a comment or link to your own ideas! Charts are for information purposes only. Not trade suggestions. DYOR (Do your own research) - act responsibly with your money.
