PEB Pacific Edge NZBreakout and retest with bollinger band squeeze
I've posted multiple times about this stock and it is no doubt high risk and speculative,
but technically it is showing bullish signs in my opinion and looking ready to move
Full disclosure I've owned this stock for a while now, and looking at long term (years) play

PEB Pacific Edge - Looking to moveI'm already in this,
but structure is interesting as it looks like a strong move is coming shortly
Triangle breakout and retest complete...
Watch this space!

PEB Pacific Edge NZXPEB I already own this as a long term investment, but interesting chart right now....
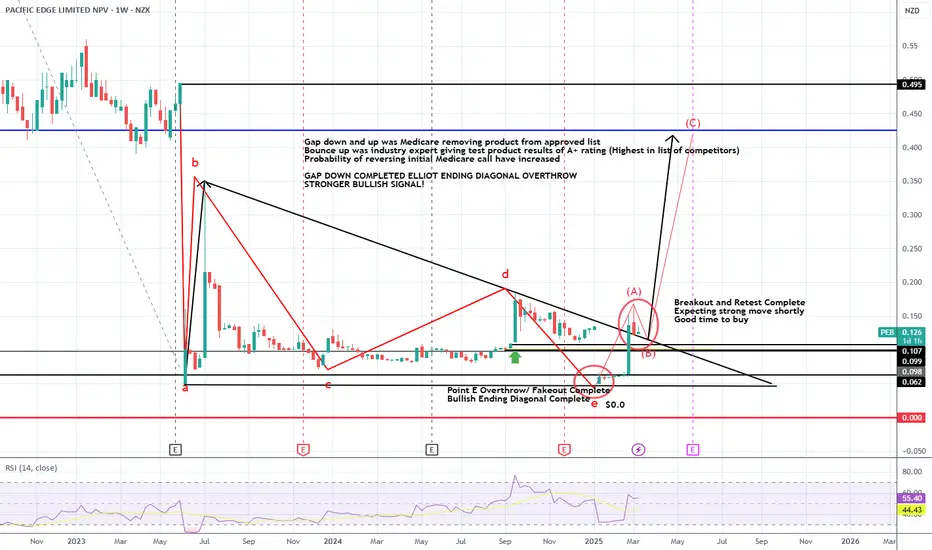
Currently had gap down due to bad Medicare news removing product from approved test list, but shortly afterwards one product was ranked highest A+ for test credibility so this may remove the previous restriction in Medicare and open market again
Technically this has a long term Elliott Wave 'Ending Diagonal' with an overthrow pattern which is technically a reversal signal, this was followed by a strong move upwards following the results of an industry comparison of products which proved very positive
Currently the Triangle has been broken and now being retested, and is now at a good point to hopefully go higher... it may need a news/ medicare catalyst, but the probability is that it is more likely technically and fundamentally to rise than to fall...
Moving from current $0.126 to $0.42 will be a 333% Return from current levels
And there are gap closes at $0.49 and $0.78c so this represents a high potential reward to risk trade
What do you do about Spark?This analysis is provided by Eden Bradfeld at BlackBull Research—sign up for their Substack to receive the latest market insights straight to your inbox.
Ah, Spark. Shocker of a result on Friday — losing in all segments (save their IoT business, which is negligible anyway). Since Jolie Hodson became CEO in 2019 the stock has decreased roughly 40%. In the last year the stock is down ~52%. The company has hocked off their tower business, closed their haywired “Spark Sports” streaming business, and seen its market share be consistently eroded by competitors. On Friday around ~$1 billion of market value was eroded. The company also spent ~$350mn on buying back shares at around ~$5 last March (buy high, sell low? Wall Street Bets logic).
It’s extraordinary to see a company that once held a dominant market position fall so flat on its face. I remember growing up with Telecom (Spark’s former name) — it was everywhere. Since becoming Spark (and Chorus uncoupling), the company has been on a dubious path — I’m not sure what got into their heads with the idea of “Spark Sport” but it was always a bizarre idea, unrelated to their core business and in a marketplace that famously does not make much money in NZ (look at TVNZ and Mediaworks…).
I also recall Spark spending a lot of time talking about “Internet of Things”. You may recall the hype of IoT a few years ago — it reminds me of a summary of a Black Mirror episode — “what if your grandma ran on batteries, innit". Think fridges and dishwashers and phones all communicating with one another. Shock horror — nobody needs their fridge to be smart; they need it to keep their food cold. Obviously Internet of Things was a bit of a bust.
All of this is to ask: what are the management of Spark on? How do they come out with this stuff? Their 2023 3-year strategy offers us some clues:
The sale of the TowerCo meant that the company spent a lot of those proceeds (~350mn) on buying back shares are at much higher price than the shares trade for now. Ideally management should buy the stock at a discount to intrinsic value and raise capital when the stock trades above intrinsic value. When mgmt and the board buy back shares at a high price relative to what the market’s value of the stock is, it brings into question their ability to assess intrinsic value. We have already talked about the ill-advised decision to do sport. I’m unsure if this constitutes as “effective portfolio management”.
I do not know what digital identity means, or what “multi-access edge compute” means.
The data centre portfolio is very small relative to Spark’s competitors, and Amazon is set to open a large data centre in NZ, as are Microsoft. Microsoft is a much bigger company and so is Amazon, so they have much more advantages of scale, by orders of magnitude. I have made a helpful chart to help visualise this.
I am not sure how Spark means to meaningfully compete with such scale.
The rest of Spark’s “strategy” can be seen here¹, which is long on words and the feel-good factor, but short on actual, quantifiable metrics. I mean, there’s this:
H1 2025 EBITDAI² was down 15.5%, at $448mn. The dividend declared was down 1c. The only part of the strategy that seems to be working is growing (reducing) the dividend in line with FCF growth (unfortunately, FCF growth is negative on FY24).
So what to do? Jolie has now been CEO and presided over value destruction — as have the board of Spark. Here’s Jolie, quoted in the Herald, on whether she’d be making any changes:
Will we see any executive changes?, the Herald asked chief executive Jolie Hodson.
“No, there are no changes I’ve got to share with you. Our focus is on making sure we’re executing at pace.”
And is she confident in her own position?
“My focus is 100% on making sure Spark is doing the things that we need to do to address the markets we’re in, but also the actions that we said we’d take and that’s what I’ll be focussed on doing,” Hodson said.
But Spark hasn’t really done thing “things they need to do”, have they? On most metrics they’re down and losing market share! And they’re not executing at pace either — MSFT and AMZN are executing data centres at pace — Spark is but a footnote.
This is the part of the piece where I ask if Jolie and her chair, Justine Smyth, perhaps they ought to consider new jobs? In most markets around the world shareholders would be braying for some blood. It’s hard to imagine “business as usual” when so much value has been destroyed.
There’s still value in Spark — Infratil acquired One/Vodafone for 6.9x EV/EBITDA, slightly above where Spark trades (~6.5x). I have little faith in the current board and management to create more value, which leads to the question of whether the company could be acquired, chopped up, and value unlocked. This is always a harder question than it seems — telecom companies and broadband assets don’t tend to be valued particularly highly or sell like hotcakes these days — look at Comcast’s recent results. You’d need an acquirer with a strong stomach and more importantly, a plan.
Work to be done.

SPARK LONG FROM THIS SUPPORT
Hey everyone! The price of Spark New Zealand (SPK.NZ) has recently dipped, and I believe it's a great buying opportunity right now.
💡 Targets:
Target 1: NZD 3.445
Target 2: NZD 3.835
Target 3: NZD 4.100
These targets seem very achievable given the stock's performance and current market conditions. 📈
Important Notes:
Please invest responsibly. I'm not a financial advisor—this is just my personal opinion and analysis.
Only invest what you can afford to lose, especially if you're new to investing. 📊
For those using Sharesies, feel free to use my referral link and get $5 free when you sign up: Sharesies Link
Good luck and happy trading! 🙌

Bullish on New Talisman GoldStarted to take a position in NTL in 2022, so was holding the bag for over two years. In 2024, decided to add to my position instead of take a 60% loss. Firstly, because they got a new CEO that appears reasonably competent, and seemed actually focussed of getting the mine into production - which I came to doubt was actually the focus for the previous Management. Then came a trickle of good news;
New Government, open to being more supportive of extractive industries,
New gravity mill was on order from Canada (no harmful chemicals used to extract the gold. There is deep-rooted anti-mining sentiment in NZ but I feel that the "small footprint" above-ground and the fact that they are not using harmful chemicals to extract the gold should make them less of a protest target),
Then the gravity mill was in the country and being assembled (price still hadn't moved yet),
Mill has a 100ton ore processing capacity (probably will need to be expanded at some point - but it is a start - at 4g/ton = NZD66,000 a day in revenue at current prices),
New fast-track mining laws from Government issued, then clarified as also applying to gold mining,
Then some big news; a new exploration permit was granted that is adjacent to the existing claim - and lies in the direction of the known gold strikes. There will be gold there, but the grades, locations, and depths are still an unknown. At least NTL will soon be adding a cash-flow to finance additional exploratory drilling.
So, my 3x estimation is based on;
No additional gold strikes in the new Rahu exploration area.
No additional ore processing capacity being brought online (additional to the 100 ton capacity gravity mill that is; which isn't quite online as yet).
So, in my eyes there was a significant margin of safety being created that could turn a good investment into a great one. We must always guard against excessive optimism, and I have defined "take profit" points identified already as mining can be a bit "boom-and-bust." In my opinion, since this share / stock was such a poor performer for so long, there is significant up-side.
One of my major concerns is that such a large percentage of the indicated and inferred gold resource is of the less certain "inferred" variety. Will be hoping for additional positive news about this over the coming weeks and months. I have a reasonable time-horizon on this. Looking for a 200% gain in the next 3 to 5 years, although it may be much earlier than that. Best of luck everyone.

NTL New Talisman NZXAlready bought this back in November, but this is an update as it has currently broken out of a triangle and also a bollinger band squeeze pattern
Likely to move higher relatively quickly now that the consolidation has completed

CVT DailyCVT closing in on 2009 low,
I've entered within the triangle, scaling in as a small early position (this is a multi year trade)
Currently broken lower as most triangles continue on, and there is a 5 wave structure lower and showing a fib cluster for a potential end of wave 5
Will buy again around the wave 5 cluster low if there are some bullish candles start showing up or clear divergence and a small candle...

CVT Monthly UpdateClose to 2009 low, looking for a reason to buy on the lower timeframes at support
Indicators are oversold as well on the monthly chart

SDL NZ On medium to long term buy watchlistCurrently in a restructure, small cap stock with good fundamentals i.e. profitable and current ration of 2.0
is a software based company so has the ability to scale quickly without large investment
Will be eyeing up a position around $0.42, with first target around $1.50 and possible exit around $2.45
This is a monthly chart so is a long term trade...
Option B could be sell enough to get original money back at $1.50 and reinvest elsewhere while holding the rest till $2.45 to cash in

NTL New Talisman Gold Mines LtdBuying long term position in high risk gold miner today
Exploration company but just purchased plant to start producing gold...
Technically this has bollinger band squeeze at $0.023 cents per share - it definitely is a penny stock! don't think I've ever bought something so low in 20 years...!!
Could have massive reward to risk if it turns profitable i.e. reward to risk >50X
I'm happy to lose the entire investment in this as the potential reward to risk is massive (and very rare...) especially in businesses that are involved in producing something of value that is tangible...
High risk for sure, but I believe they have done 11 years of research and starting to buy equipment to produce so they see value there...

IPL Investore Property Limited Thought it was interesting to see a Nen star pattern on a monthly chart
Personally the upside is not large enough as there are a couple of fundamental negatives which are putting me off this stock
Posting out of interest only...

FBU Weekly Closer view of ButterflyAppears to have expanding triangle in the CD leg of a larger butterfly pattern
Hoping it drops to around $1.80 and will buy around there with any buying pressure showing

FBU Monthly Fletcher Building On trading halt while they do a $700mil capital raise
Hoping it drops to ~$1.80 ish for a long term buy due to technicals but fundamentally needs a restructure of debt or more equity...
Carrying too much debt from memory due to their residential developments with long cash cycle payments which is problematic when the market stalls and buyers dry up
Basically too much inventory...
Hopefully they can convert some of these back into liquid cash.... and move on and perhaps focus a little more on the commercial projects and building materials that have better cash cycles

FPH Fisher and Paykel Monthly Possible Butterfly ZonesNo action, but FYI only
Bit early, but possible butterfly levels on FPH on Monthly chart
Indicator is climbing up into the overbought zone, but that does not mean much right now
likely to keep climbing in short to medium term, but parabolic moves are also quickly reversed as there are no real levels of support on large bars
Levels to watch...

PEB Daily Breakout... large gap to closeHigher risk trade but also high potential reward to risk...
Full disclosure I own this stock already as a long term play
Looking to close gap and sell out half of holding and reinvest it elsewhere...

PEB NZ Pacific Edge Limited MonthlyI'm already in this one but is breaking out of another triangle
There are gaps to close and the upside is relatively high compared to risk
This is a loss making cancer diagnostic company but technically at support and breaking out

FBU Fletcher Building Monthly Near buying levels...FBU Fletcher building near buying levels
Currently getting near demand level, currently has forward dividend of 11% but earnings have shrunk dramatically to loss making and likely going to restructure business or resize operations
No action as yet as there is no clear signal right now to buy, but it is definitely on my watchlist and hoping it drops in the next 2-3 months so I can buy lower at multiple support levels and lift my dividend % when it turns around again
The gap between the preferred $2.70 and $1.80 is quite wide so I might dip into a position at $2.70 and then load up the rest at $1.80 if it gets there
Fletchers is a pretty iconic NZ business but does have a pretty high debt level of 106% debt to equity so there needs to be a shift to reduce this if this involves developments that are funded by debt they need to be converted back into equity...
Likely needs some management and operational changes as current formula of negative profit and high debt to equity is not working... nor sustainable...

Rakon Daily 5 Wave projectionRakon NZ
Possible 5 wave cluster levels close to longer term demand level
Will be buying when it gets between 0.48-0.42c
Fibonacci projection clusters are there and long term demand level

Comvita inverted hammer monthly chartFurther to earlier post, close up showing the inverted hammer outside of the bollinger bands

Comvita Monthly Buy ZoneBuying into Comvita
Monthly chart going back decades
Has multiple reasons to buy technically, and is selling far below book value, has low debt to equity and current ratio of 5.54 so assets far outweigh liabilities
Low dividend, but this is really a long term capital gains play say 5 years should be up to at least $5-$6

Rakon NZ long term buying level approachingRakon Monthly chart
I'm currently looking at long term investments to hold for years, and noticed this one
Current price is $0.80, but I think it could easily fall to $0.41c
Downside $0.42c
Dividend ~ ~5% at that price level
Potential capital gain, 300% gain is pretty easy to get to $1.20, the all time high was $5.80
Could easily hold for a couple of years sell half and make 100%+ on your original money and still own some shares
The upside with volatile stocks like this is that there are very few real support or resistance levels on the chart i.e. big bars... these can easily get blown through both ways as there are no major order pools there that take time to fill
See what happens but its on my watchlist with price alerts set

Air New Zealand Monthly ChartAir New Zealand monthly chart,
Descending triangle which is at 25 year low, triangle are often wave 4s which suggest it still wants to go lower
I actually want to see this break the low and create a 5th wave triangle overthrow as shown
This would be a great buying zone as the current price of $0.587 is offering a 7% dividend, if it were to drop to 42-44cents then it will increase to 10% yield, going back to pre COVID, the dividend went up to 0.08c
Downside is $0.40
Upside is dividend 7-10% possibly increasing up to 20%
Capital appreciation even up to the top of the triangle is 300% gain...
Risk is the company is carrying too much debt and the operating profit is very low at sub 5%, so there likely needs to be a restructure
Blowing the price to a new all time low will definitely create a catalyst for change and offer a good buying opportunity
This is partially government owned so very very unlikely to go bankrupt, but can still go through a restructure to reset debt and operating expense ratios
