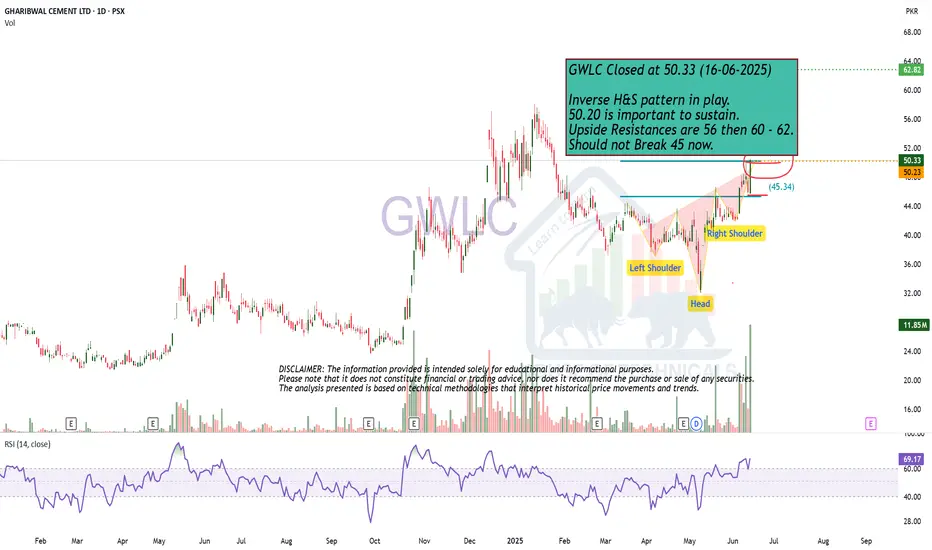
Inverse H&S pattern in play.GWLC Closed at 50.33 (16-06-2025)
Inverse H&S pattern in play.
50.20 is important to sustain.
Upside Resistances are 56 then 60 - 62.
Should not Break 45 now.
SLGL LONG TRADE 16-06-2025SLGL LONG TRADE
- *Initial Trend*: Upon induction in PSX, SLGL formed an apex, reaching a high of 20.47, followed by a corrective oblique pullback channel - which is actually a Price Action Bull Flag.
- *Higher High Attempt*: The stock attempted to post a higher high but was unsuccessful, indicating potential resistance.
- *Strong Day Closing Candle*: After completing its full wave cycle, SLGL formed a robust Marabuzo candle, indicating potential bullish momentum.
🚨 TECHNICAL BUY CALL – SLGL🚨
- *Buy Levels*:
- Buy 1: 16.13
- Buy 2: 15.44
- Buy 3: 14.7
- TP1: 16.8
- TP2: 17.45
- TP3: 17.95
- *Stop Loss*: 14.25 (closing basis)
- *Risk-to-Reward Ratio*: 1:2.21
Caution: Close at least 50% position size at TP1 and then trail SL to avoid losing incurred profits in case of unforeseen market conditions.
PLEASE BOOST AND SHARE THE IDEA IF YOU FIND IT HELPFUL.

BNL LONG TRADE (THIRD STRIKE) 16-06-2025BNL Long Trade (Third Strike)
Rationale: After its inception in PSX in 2013, BNL went into a tremendous uptrend, reaching a high of Rs. 61.7, then corrected and down trended to Rs. 12. The stock consolidated for 4 years between Rs. 49 and Rs. 12. Recent rally broke out of this accumulation zone, creating bullish FVGs and IFDZS for a safe long trade entry.
🚨 TECHNICAL BUY CALL – BNL🚨
- Buy 1: Rs. 45.90
- Buy 2: Rs. 44.30
- Buy 3: Rs. 38.6
- TP 1: Rs. 58.7
- TP 2: Rs. 67.9
- TP 3: Rs. 74.77
- TP 4: Rs. 86.70
Stop Loss - Below Rs. 34 ON DAY CLOSING
Risk-Reward Ratio- 3.65
aution: Close at least 50% position size at TP1 and then trail SL to avoid losing incurred profits in case of unforeseen market conditions.
PLEASE BOOST AND SHARE THE IDEA IF YOU FIND IT HELPFUL.

CRTM LONG TRADE 17-06-2025CRTM ONG TRADE
Rationale - CRTM broke out of a trading range, bounded by a resistance line (red dotted line), and a wedge pattern forming an inverted head and shoulders. Although this pattern isn't always a successful reversal indicator, the powerful breakout momentum and volume dynamics in this case suggest a strong potential for a breakout and upside movement.
🚨 TECHNICAL BUY CALL – CRTM🚨
- Buy 1: Current level (Rs. 17.58)
- Buy 2: Rs. 16.96
- Buy 3: Rs. 16.40
Target Prices
- TP 1: Rs. 18.6
- TP 2: Rs. 19.98
- TP 3: Rs. 22.31
Stop Loss- Below Rs. 15.4 closing basis
Risk-Reward Ratio - 1:3.48
Caution: Close at least 50% position size at TP1 and then trail SL to avoid losing incurred profits in case of unforeseen market conditions.
PLEASE BOOST AND SHARE THE IDEA IF YOU FIND IT HELPFUL.

NML LONG TRADE 17-06-2025NML LONG TRADE (1H)
Rationale: NML previously surged in a vertical uptrend, then consolidated in a trading range with various chart patterns. The stock is now poised to break out and resume its upward journey.
🚨 TECHNICAL BUY CALL –NML🚨
- Buy 1: Current level (Rs. 126.5)
- Buy 2: Rs. 122.6
- Buy 3: Rs. 119.1
- TP 1: Rs. 132
- TP 2: Rs. 138
- TP 3: Rs. 144
Stop Loss - Below Rs. 115 closing basis
Risk-Reward Ratio- 1: 3.1
Caution: Close at least 50% position size at TP1 and then trail SL to avoid losing incurred profits in case of unforeseen market conditions.
PLEASE BOOST AND SHARE THE IDEA IF YOU FIND IT HELPFUL.

FECTC LONG TRADE/INVESTMENT 16-06-2025FECTC Technical Long & Investment Buy Call
Rationale: FECTC broke out of a range in Oct 2024, achieved a target of 132, and then corrected in an ABC pattern. After pulling back to the breakout level, the stock shows good price action with volumes, suggesting a resumption of the uptrend.
🚨 TECHNICAL BUY CALL – FECTEC🚨
- Buy 1: Current level (Rs. 77-76.8)
- Buy 2: Rs. 69.6
- Buy 3: Rs. 62.4
- TP 1: Rs. 97.52
- TP 2: Rs. 113.5
- TP 3: Rs. 129.5
- Long-term Investment TP: Rs. 159.8
Stop Loss- Below Rs. 50.8
Risk-Reward Ratio- 1:5
Caution: Close at least 50% position size at TP1 and then trail SL to avoid losing incurred profits in case of unforeseen market conditions.
PLEASE BOOST AND SHARE THE IDEA IF YOU FIND IT HELPFUL.

SSGC LONG TRADE - SECOND STRIKE 17-06-2025SSGC Technical Buy Call - Second Strike on 1H
Rationale: SSGC previously surged from Rs. 10 to Rs. 50 in a few months, then reaccumulated in a double bottom bull flag pattern. With a bullish access zone as support, the stock is poised for further upward movement.
🚨 TECHNICAL BUY CALL – SSGC🚨
- Buy 1: Current level (Rs. 45)
- Buy 2: Rs. 44
- Buy 3: Rs. 43
- TP 1: Rs. 50.6
- TP 2: Rs. 55.5
- TP 3: Rs. 60.5
Stop Loss - Below Rs. 40 closing basis
Risk-Reward Ratio-1:3
Caution: Close at least 50% position size at TP1 and then trail SL to avoid losing incurred profits in case of unforeseen market conditions.
PLEASE BOOST AND SHARE THE IDEA IF YOU FIND IT HELPFUL.

Strong Bullish Divergence on Bigger tf.FECTC Closed at 76.81 (16-06-2025)
Strong Bullish Divergence on Bigger tf.
Hidden Bullish Divergence also appearing.
Taken Support from 0.618 fib level.
Cup & Handle Formation on Bigger tf.
Upside Resistance is around 126 - 133
Crossing & Sustaining this level may lead it
towards 220 - 240.
However, it should not break 55 now.

FTMM LONG TRADE 17-06-2025FTMM Technical Buy Call
Rationale - FTMM broke out of a prolonged range formation (since Nov 2023) at Rs. 5.02, forming a scale pattern beforehand. We expect the stock to reach minimum quantified displacement targets.
🚨 TECHNICAL BUY CALL – FTMM🚨
- Buy 1: Current level (Rs. 5.52)
- Buy 2: Rs. 5.02
- Buy 3: Rs. 4.82
- TP 1: Rs. 5.89
- TP 2: Rs. 6.45
- TP 3: Rs. 6.95
Stop Loss - Below Rs. 4.40
Risk-Reward Ratio - 3.5
Caution: Please buy in 3 parts in buying range. Close at least 50% position size at TP1 and then trail SL to avoid losing incurred profits in case of unforeseen market conditions.
PLEASE BOOST AND SHARE THE IDEA IF YOU FIND IT HELPFUL.

MERIT LONG TRADE - 17-06-2025 (MERIT PACKAGING)MERIT Technical Buy Call
Rationale - MERIT broke out of a prolonged range (Rs. 7.23 - Rs. 14) since Oct 2022 with strong volume distribution, forming a bullish IFDZ and other supportive patterns. These levels are expected to act as barriers against downward movement.
🚨 TECHNICAL BUY CALL – MERIT🚨
- Buy 1: Current level (Rs. 14.92)
- Buy 2: Rs. 14.20
- Buy 3: Rs. 13.50
- TP 1: Rs. 15.97
- TP 2: Rs. 17.15
- TP 3: Rs. 18.30
Stop Loss - Below Rs. 12.00 closing basis
Risk-Reward Ratio- 3.31
Caution: Please buy in 3 parts in buying range. Close at least 50% position size at TP1 and then trail SL to avoid losing incurred profits in case of unforeseen market conditions.
PLEASE BOOST AND SHARE THE IDEA IF YOU FIND IT HELPFUL.
4 days ago

SSOM LONG TRADE 17-06-2025SSOM Long Trade
Rationale: SSOM previously surged from Rs. 87 to Rs. 900 (over 10x gain) from mid-March to mid-May. Despite recent correction/consolidation, price action suggests potential for further upside.
🚨 TECHNICAL BUY CALL – SSOM🚨
- Buy 1: Current level (Rs. 775)
- Buy 2: Rs. 782
- Buy 3: Rs. 762
- TP 1: Rs. 830
- TP 2: Rs. 880
- TP 3: Rs. 922
- TP 4: Rs. 970
Stop Loss - Below Rs. 725
Risk-Reward Ratio - 1: 4.83
Caution: Close at least 50% position size at TP1 and then trail SL to avoid losing incurred profits in case of unforeseen market conditions.
PLEASE BOOST AND SHARE THE IDEA IF YOU FIND IT HELPFUL.

HINO LONG TRADE - SECOND STRIKE 17-06-2025HINO Technical Buy Call
Rationale : HINO broke out of a downtrend channel (marked in pink) from the beginning of this year, previously achieving targets after our call. We identify a second opportunity for a profitable trade.
🚨 TECHNICAL BUY CALL – HINO🚨
- Buy 1: Current level (Rs. 419)
- Buy 2: Rs. 410
- Buy 3: Rs. 398
- TP 1: Rs. 440
- TP 2: Rs. 456
- TP 3: Rs. 480
- TP 4: Rs. 499
Stop Loss - Below Rs. 374 closing basis
Risk-Reward Ratio - 1:4
Caution: Close at least 50% position size at TP1 and then trail SL to avoid losing incurred profits in case of unforeseen market conditions.
PLEASE BOOST AND SHARE THE IDEA IF YOU FIND IT HELPFUL.

DSIL LONG TRADE 16-06-2025DSIL Long Trade
Rationale: DSIL broke out of a bearish channel (potentially reversing trend) and seems ready to resume its uptrend. Targets are deduced from price action and quantified displacement method.
🚨 TECHNICAL BUY CALL – DSIL🚨
- Buy 1: Current level (Rs. 5.9)
- Buy 2: Rs. 5.7
- Buy 3: Rs. 5.3
- TP 1: Rs. 6.51
- TP 2: Rs. 7.10
- TP 3: Rs. 7.60
- TP 4: Rs. 8.20
Stop Loss - Below Rs. 5 closing basis
Risk-Reward Ratio - 1:3
Caution: Close at least 50% position size at TP1 and then trail SL to avoid losing incurred profits in case of unforeseen market conditions.
PLEASE BOOST AND SHARE THE IDEA IF YOU FIND IT HELPFUL.


PACE LONG TRADE 16-06-2025PACE LONG TRADE
Rationale
PACE recently completed an ABC correction within a bearish channel, which acted as a bull flag. The stock broke out of this channel with significantly high volumes (5x) and strong follow-through, indicating potential upside.
🚨 TECHNICAL BUY CALL – PACE🚨
- Buy 1: Current level (Rs. 6.32)
- Buy 2: Rs. 5.9
- Buy 3: Rs. 5.7
- TP 1: Rs. 6.7
- TP 2: Rs. 7.0
- TP 3: Rs. 7.4
- TP 4: Rs. 7.8
Stop Loss - Below Rs. 5.5 closing basis
Risk-Reward Ratio- 1:3.2
Caution: Close at least 50% position size at TP1 and then trail SL to avoid losing incurred profits in case of unforeseen market conditions.
PLEASE BOOST AND SHARE THE IDEA IF YOU FIND IT HELPFUL.

DAAG LONG TRADE 16-06-2025DAAG Long Trade
Rationale : DAAG has been in a bearish channel (bull flag) since Dec 2024. Recently, the stock trended at the upper level of the channel, absorbing overhead supply. Today, it broke out of the channel with a huge volume metric imbalance and gradient, taking price above the axis line.
🚨 TECHNICAL BUY CALL – DAAG🚨
- Buy 1: Current level (Rs. 92)
- Buy 2: Rs. 86.5
- Buy 3: Rs. 82.2
Target Prices
- TP 1: Rs. 100
- TP 2: Rs. 116.8
- TP 3: Rs. 129.8
Stop Loss - Below Rs. 76 closing basis
Risk-Reward Ratio1:- 3.25
Caution: Close at least 50% position size at TP1 and then trail SL to avoid losing incurred profits in case of unforeseen market conditions.
PLEASE BOOST AND SHARE THE IDEA IF YOU FIND IT HELPFUL.

PIAHCLA LONG TRADE (SECOND STRIKE) 16-06-2025PIAHCLA Buy Call - Second Strike
Previous Performance : We recently gave a buy call for PIAHCLA, which achieved all its given targets.
Rationale: PIAHCLA broke out of a range (Rs. 12.9 - Rs. 21.2) and assumed a new uptrend. We expect the stock to achieve targets based on quantified displacements and overlying supply zones.
🚨 TECHNICAL BUY CALL – PIAHCLA🚨
- Buy 1: Current price (Rs. 26.1)
- Buy 2: Rs. 22.4
- Buy 3: Rs. 20.5
- TP 1: Rs. 26.4
- TP 2: Rs. 28.2
- TP 3: Rs. 29.8
Stop Loss - Below Rs. 19.5 closing basis
Risk-Reward Ratio - 1:4
Caution: Close at least 50% position size at TP1 and then trail SL to avoid losing incurred profits in case of unforeseen market conditions.
PLEASE BOOST AND SHARE THE IDEA IF YOU FIND IT HELPFUL.

PIAHCLA LONG TRADE 05-06-2025PIAHCLA LONG TRADE
PIAHCLA has been trading in a converging channel since June 2024. Recently, the stock gave a breakout from this channel, preceded by a selling climax and a strong upward reversal (spring-like motion) supported by good volume gradient.
The breakout has also created an IFDZ, which will act as a barrier against downward movements. Considering these factors, we believe this trade setup has high probability and is relatively safe.
🚨 TECHNICAL BUY CALL – PIAHCLA🚨
- BUY1: 19.5 (current level)
- BUY2: 18.9
- BUY3: 18.3
- TP1: 21.6
- TP2: 23.7
🛑 STOP LOSS: BELOW 17.1 DAILY CLOSE
📊 RISK-REWARD: 1:4.5
Caution: Close at least 50% position size at TP1 and then trail SL to avoid losing incurred profits in case of unforeseen market conditions.
PLEASE BOOST AND SHARE THE IDEA IF YOU FIND IT HELPFUL.

Bullish on All Time Frames.MERIT Closed at 13.95 (13-06-2025)
Bullish on All Time Frames.
Immediate Support lies around 13 - 13.20 &
then around 12 - 12.20
However, 11 - 11.10 may be re-tested in extreme
pressure.
On the flip side, once 14.20 is Sustained, we may
witness upside towards 16 - 17 & then 19 -20

Netsol - Inverse H&S into playNetsol is in its buyback phase which is about to be over in June.
Inverse H&S is in play where it hit its daily pivot level. If it now makes a higher high and higher low, 2nd shoulder will be confirmed. Alternatively, it may hit 123 (bottom of its first shoulder) before going upward. Upside short term target will be 183.

MLCF - Cooling down after a long rallyMaple Leaf is cooling down after a long rally and is preparing for touching its all time high.
It struck Fib 0.618 level and is now spending some time here as expected. It may retrace to its Fib 0.5 level (73 to 74) before again going up.
Once it crosses and gives monthly closing above 88, we can see it hitting 108 and then 133 in quick succession.


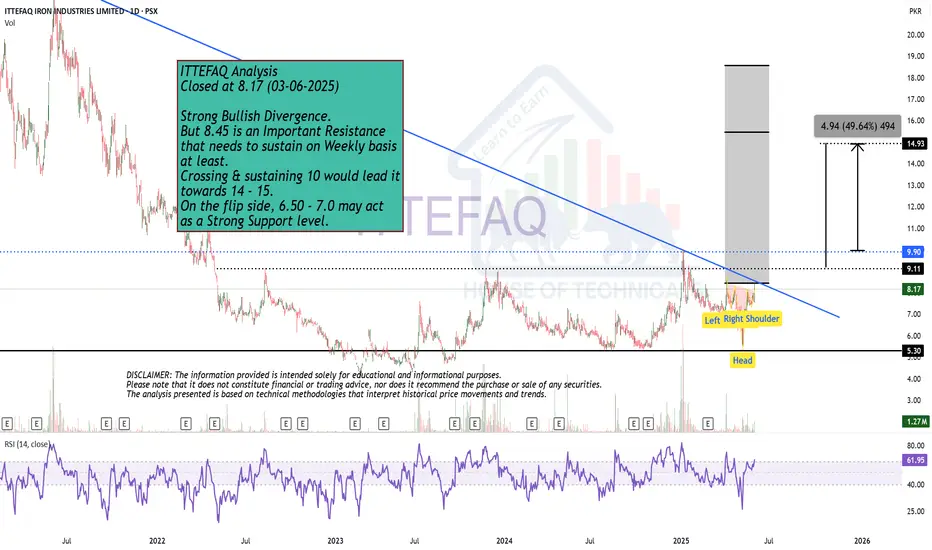
Strong Bullish Divergence. Closed at 8.17 (03-06-2025)
Strong Bullish Divergence.
But 8.45 is an Important Resistance
that needs to sustain on Weekly basis
at least.
Crossing & sustaining 10 would lead it
towards 14 - 15.
On the flip side, 6.50 - 7.0 may act
as a Strong Support level.