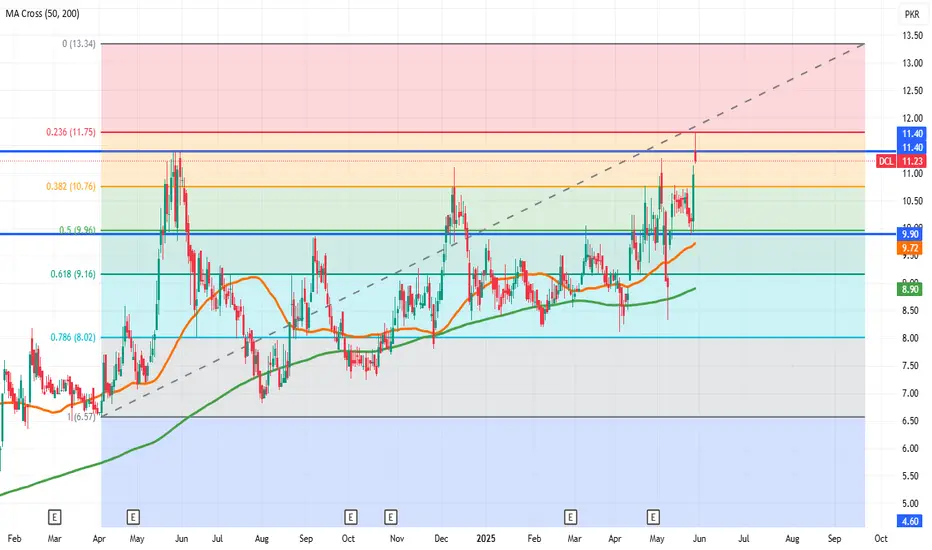
DCL is ready to flyYesterday DCL was above resistance of 11.4 and closed slightly below it. Also above 50 and 200 MA on daily chart. Fresh Entry is possible in it. TP is 13.3 and SL is 9.9
TRIPF LONG TRADETRIPF was previously in downtrend till May 2024, then went into Wyckoff Accumulation phase till Nov 2024. It broke out of this Re-Accumulation Phase with assertive Volume Gradient. It also retested the Breakout at the OB causing the Breakout. It also plotted a HL. With all above aspects factored in, we foresee an impending up move.
🚨 TECHNICAL BUY CALL – TRIPF🚨
🎯 BUY ZONE: Rs. 120-130
📈 TP : Rs. 158
🛑 STOP LOSS: BELOW Rs. 110 (Daily Close)
📊 RISK-REWARD: High Conviction | 1:3.54
Caution: Please buy in 3 parts in buying range. Close at least 50% position size at TP1 and then trail SL to avoid losing incurred profits in case of unforeseen market conditions.
PLEASE BOOST AND SHARE THE IDEA IF YOU FIND IT HELPFUL.

KEL LONG TRADEKEL is trading in a range of 3.60-6.30 since Jan 2024.
Recently, it has take support from Strong Demand Zone at the bottom of the Trading Range and has given reversal upwards which is validated by Volume Distribution.
As per simple concept of trading in a range " Buy Low Sell High ", appropriate Buying and Selling Levels are given below.
Targets having been calculated from overlying Bearish Order Blocks/ Supply Zones
KEL is expected to reach its upside targets of the range but it might some time.
🚨 TECHNICAL BUY CALL –KARACHI ELECTRIC LTD (PSX: KEL) 🚨
🎯 BUY ZONE: Rs. 4.00-4.20
📈 TP 1: Rs. 4.90
📈 TP 2: Rs. 5.80
🛑 STOP LOSS: Below Rs. 3.60 (Daily Close)
📊 RISK-REWARD: High Conviction | 1:3+
Caution:
Please close at least 50% position size at TP1 and then follow strict trailing SL to avoid losing incurred profits in case of unforeseen market conditions

FCL LONG TRADEFCL was previously in uptrend posting a High of 29.70, it has been in a corrective downward eg since then. It has given strong signs of upward reversal.
fOUR things validate its reversal upwards:
1. Crossed above 20 EMA
2. Posted a Higher Low
3. Made a 1H Bullish Breaker Block
4. Much Heavier Volumes on Up leg so far(47M)
🚨 TECHNICAL BUY CALL – FCL 🚨
🎯 BUY ZONE: Rs. 23.00-23.30
📈 TP 1: Rs. 24.99
📈 TP 2: Rs. 25.80
🛑 STOP LOSS: BELOW Rs 22.40 (Daily Close)
📊 RISK-REWARD: High Conviction | 1:4.5
Caution: Please close at least 50% position size at TP1 and then follow strict trailing SL to avoid losing incurred profits in case of unforeseen market conditions
PLEASE BOOST THE IDEA IF YOU FIND IT HELPFUL.

ANL LONG TRADEANL has been stuck in Trading Range since long.
According to simplest method of Trading in a Trading range "BUY LOW SELL HIGH", it has recently touched the bottom of trading range and has given strong signs of upward reversal.
Four things validate its reversal upwards:
1. Crossed above 1H 20 EMA
2. Posted a Higher Low
3. Made a 1H Bullish FVG
4. Made a 1H Bullish Breaker Block
4. Much Heavier Volumes on Up leg so far
🚨 TECHNICAL BUY CALL – ANL🚨
🎯 BUY ZONE: Rs. 7.90-8.10
📈 TP1 : Rs. 8.65
📈 TP2 : Rs. 9.00
🛑 STOP LOSS: BELOW Rs 7.60(Daily Close)
📊 RISK-REWARD: High Conviction | 1:2.75
Caution: Please close at least 50% position size at TP1 and then follow strict trailing SL to avoid losing incurred profits in case of unforeseen market conditions
PLEASE BOOST THE IDEA IF YOU FIND IT HELPFUL.

PPL SHORT- SELL TRADEPPL was in uptrend – but it broke its uptrend trend line in 1st week of April and created a Bearish Breaker Block. It has now retested the breakdown level and resumed the downward move. Volume distribution analysis supports its downward move in near future.
🚨 TECHNICAL SHORT SELL CALL – PPL🚨
🎯 BUY ZONE: Rs. 170-178
📈 TP1 : Rs. 165
📈 TP2 : Rs. 156
🛑 STOP LOSS: BELOW Rs. 185 (Daily Close)
📊 RISK-REWARD: Medium Conviction | 1: 2.3
Caution: Please close at least 50% position size at TP1 and then follow strict trailing SL to avoid losing incurred profits in case of unforeseen market conditions
PLEASE BOOST THE IDEA IF YOU FIND IT HELPFUL.

OTSU UNORTHODOX LONG TRADEOTSU was previously in downtrend till November 2022. Later on it switched to upward slanting consolidation for 2.5 years. It has recently broken out of this Accumulation Phase powerfully. It is currently in a pullback in spike phase of uptrend. Pull backs in this kind of spike phases are usually shallow and brief. Therefore, it is wise/profitable to accumulate OTSU at Current Price (CP) and close of each 1D candle – till it crosses 340 again. Profit Taking should be at the culmination of next up-leg.
🚨 TECHNICAL BUY CALL – OTSU 🚨
🎯 BUY STRATEGY: Buy @ CP (275) and close of every 1D candle till it reaches 340.
📈 TP1 : Rs. 340
📈 TP2 : Rs. 370
🛑 STOP LOSS: BELOW Rs. 210 (Daily Close)
📊 RISK-REWARD: High Conviction | 1:3 (tentatively)
Caution: Please buy in 3 parts in buying range. Close at least 50% position size at TP1 and then trail SL to avoid losing incurred profits in case of unforeseen market conditions.
PLEASE BOOST THE IDEA IF YOU FIND IT HELPFUL.

MFL LONG TRADEMFL gave an ERC breakout in Dec 2024 - touching a high of 54.5 but showed SOT shortly and started trading in a downward corrective channel. This steep downward channel is actually a Bull Flag as per Price Action Principles. MFL has shown reversal with supportive Volume Gradient confirmations and upward movement from Golden Ratio Fibonacci retracement. Reversal trades are one of the best R:R trades.
🚨 TECHNICAL BUY CALL – MFL 🚨
🎯 BUY ZONE: Rs. 34-40.85
📈 TP1 : Rs. 47
📈 TP2 : Rs. 54.6
🛑 STOP LOSS: BELOW Rs. 29.9 (Daily Close)
📊 RISK-REWARD: High Conviction | 1:4.2
Caution: Please buy in 3 parts in buying range. Close at least 50% position size at TP1 and then trail SL to avoid losing incurred profits in case of unforeseen market conditions.
PLEASE BOOST AND SHARE THE IDEA IF YOU FIND IT HELPFUL.

PTC LONG TRADEPTC broke out from its WYCKOFF Accumulation Phase and trading range with remarkable gain, plotting a high of 29. It went into pullback, in the form of a Corrective Downward Channel for 5 months – which is evidently a Bull Flag as seen in chart. It has successfully given breakout of this channel/Bull Flag with massive scores on Volume Gradient. A HL, price above EMA-20 on 1D TF, retest of breakout, formation of SPRG and price action, everything confirms the reversal and indicate a potentially good trade.
🚨 TECHNICAL BUY CALL – PTC 🚨
🎯 BUY ZONE: Rs. 21-23.25
📈 TP1 : Rs. 25
📈 TP2 : Rs. 26
📈 TP3 : Rs. 27
🛑 STOP LOSS: BELOW Rs. 19.32 (Daily Close)

KSBP LONG TRADE KSBP is in uptrend since Sep 2023. Then it entered Wyckoff Re-Accumulation Phase from Nov 2024 till April 2025. It broke out of this Re-Accumulation Phase with asserted Volume Gradient. It also retested the Breakout at the OB causing the Breakout, made a SPRG at newly established support level. It also plotted HH and HL. With all above aspects factored in, we foresee an impending up move.
🚨 TECHNICAL BUY CALL – KSBP🚨
🎯 BUY ZONE: Rs. 166-172
📈 TP : Rs. 204
🛑 STOP LOSS: BELOW Rs. 158 (Daily Close)
📊 RISK-REWARD: High Conviction | 1:4
Caution: Please buy in 3 parts in buying range. Close at least 50% position size at TP1 and then trail SL to avoid losing incurred profits in case of unforeseen market conditions.
PLEASE BOOST AND SHARE THE IDEA IF YOU FIND IT HELPFUL.

Bearish Divergence played wellSNGP Analysis
Closed at 117.34 (29-05-2025)
Bearish Divergence played well & dragged the
price from 129 -130 towards 113.
Now, Seems like HL has been printed around 113 - 114.
If this level is broken, we may witness further downside
towards 102 - 107
Immediate Resistance is around 123 - 125 & then
around 130 - 132

Inverse H & S Possible..INIL Analysis
Closed at 164.41 (29-05-2025)
Bullish on Daily TF.
Weekly Closing above 155 - 156
is a good sign.
However, 169 - 170 is an Important
Resistance zone.

GTYR LONG/INVESTEMENT TRADEGTYR previously was in downtrend till May 2023. Then it reversed and made a Cup & Handle Pattern and gave breakout with supportive VD – It has now completed its pullback in the shape of handle/downward channel, and reversed!
🚨 TECHNICAL BUY CALL –GTYR 🚨
🎯BUY1: Rs. 36-41
📈 TP1 : Rs. 52.7
📈 TP2 : Rs. 74.8
🛑 STOP LOSS: BELOW Rs. 30 (Daily Close)
📊 RISK-REWARD: 1:3.6
Caution: Please buy on levels in 3 parts. Close at least 50% position size at TP1 and then trail SL to avoid losing incurred profits in case of unforeseen market conditions.
PLEASE BOOST AND SHARE THE IDEA IF YOU FIND IT HELPFUL.

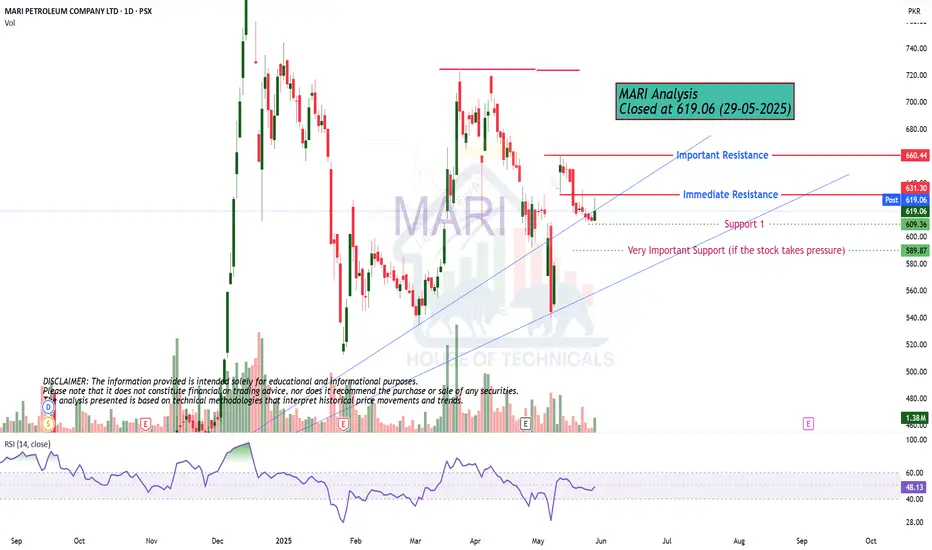
MARI LONG TRADEMARI has been consolidating in accumulation zone as per Wyckoff methodology, this area can also be seen as Double Bottom Bull Flag as per Al Brooks Price Action Method.
Above scenario supports a rise in Mari to test and exceed previous highs.
🚨 TECHNICAL BUY CALL –MARI 🚨
🎯BUY1: Rs. 620-630
📈 TP1 : Rs. 655
📈 TP2 : Rs. 698
📈 TP3 : Rs. 718
🛑 STOP LOSS: BELOW Rs. 600 (Daily Close)
📊 RISK-REWARD: 1:4.8
Caution: Please buy on levels. Close at least 50% position size at TP1 and then trail SL to avoid losing incurred profits in case of unforeseen market conditions.
PLEASE BOOST AND SHARE THE IDEA IF YOU FIND IT HELPFUL.

CPHL LONG TRADECPHL has been in bear channel which is actually a Bull flag – it performed a selling climax and then displayed a Bullish Reversal. It has also posted a HL, supported by VG.
🚨 TECHNICAL BUY CALL –CPHL 🚨
🎯BUY1: Rs. 84-87
📈 TP1 : Rs. 94
📈 TP2 : Rs. 99.9
🛑 STOP LOSS: BELOW Rs. 79 (Daily Close)
📊 RISK-REWARD: 1:3.4
Caution: Please buy on levels. Close at least 50% position size at TP1 and then trail SL to avoid losing incurred profits in case of unforeseen market conditions.
PLEASE BOOST AND SHARE THE IDEA IF YOU FIND IT HELPFUL.

ILP LONG TRADEAfter completing its uptrend Elliot Wave Cycle, ILP has recently been trending in downward channel and has completed Golden Ratio of Correction after going through Selling Climax. It has shown reversal from OB
🚨 TECHNICAL BUY CALL –ILP 🚨
🎯BUY1: Rs. 55-60
📈 TP1 : Rs. 64
📈 TP2 : Rs. 72.8
🛑 STOP LOSS: BELOW Rs. 52 (Daily Close)
📊 RISK-REWARD: 1:4.95
Caution: Please buy on levels. Close at least 50% position size at TP1 and then trail SL to avoid losing incurred profits in case of unforeseen market conditions.
PLEASE BOOST AND SHARE THE IDEA IF YOU FIND IT HELPFUL.

PTL LONG TRADEPTL was in downtrend since its inception in PSX. It then formed and inverted H&S Pattern on 1W TF. It broke out of this pattern and formed a Bullish OB. It then went into Re-Accumulation Zone. It has now performed a retest after the Breakout at the bottom of 1W Breaker Block. It has started its upward reversal.
🚨 TECHNICAL BUY CALL –PTL🚨
🎯BUY1: Rs. 38-40
📈 TP1 : Rs. 44.4
📈 TP2 : Rs. 54
🛑 STOP LOSS: BELOW Rs. 33 (Daily Close)
📊 RISK-REWARD: 1:2.85
Caution: Please buy on levels. Close at least 50% position size at TP1 and then trail SL to avoid losing incurred profits in case of unforeseen market conditions.
PLEASE BOOST AND SHARE THE IDEA IF YOU FIND IT HELPFUL.

SSGC LONG TRADESSGC has completed Elliot Wave 1-2-3 and presently it is in complex corrective wave 4 (reaching to the Fibb Golden ratio), which also happens to be Wyckoff Accumulation Phase. It has started its reversal upwards to the completion of Wave Cycle 1-2-3-4-5. Volume Gradient is supportive of this scenario.
🚨 TECHNICAL BUY CALL – SSGC🚨
🎯BUY1: Rs. 33-35
📈 TP1 : Rs. 43
📈 TP2 : Rs. 50
📈 TP3 : Rs. 57.7
🛑 STOP LOSS: BELOW Rs. 30 (Daily Close)
📊 RISK-REWARD: 1:5.4
Caution: Please buy on levels. Close at least 50% position size at TP1 and then trail SL to avoid losing incurred profits in case of unforeseen market conditions.
PLEASE BOOST AND SHARE THE IDEA IF YOU FIND IT HELPFUL.

ATBA LONG TRADEATBA was previously in uptrend and made a healthy swing pullback till Golden Ration of Fibb zone. Now its has shown reversal, confirmed by Volume Gradient.
🚨 TECHNICAL BUY CALL – ATBA🚨
🎯 BUY1: Rs. 274
BUY2: when crosses 290
📈 TP1 : Rs. 320
📈 TP2 : Rs. 340
🛑 STOP LOSS: BELOW Rs. 250 (Daily Close)
📊 RISK-REWARD: 1:2.4
Caution: Please buy on levels. Close at least 50% position size at TP1 and then trail SL to avoid losing incurred profits in case of unforeseen market conditions.
PLEASE BOOST AND SHARE THE IDEA IF YOU FIND IT HELPFUL.

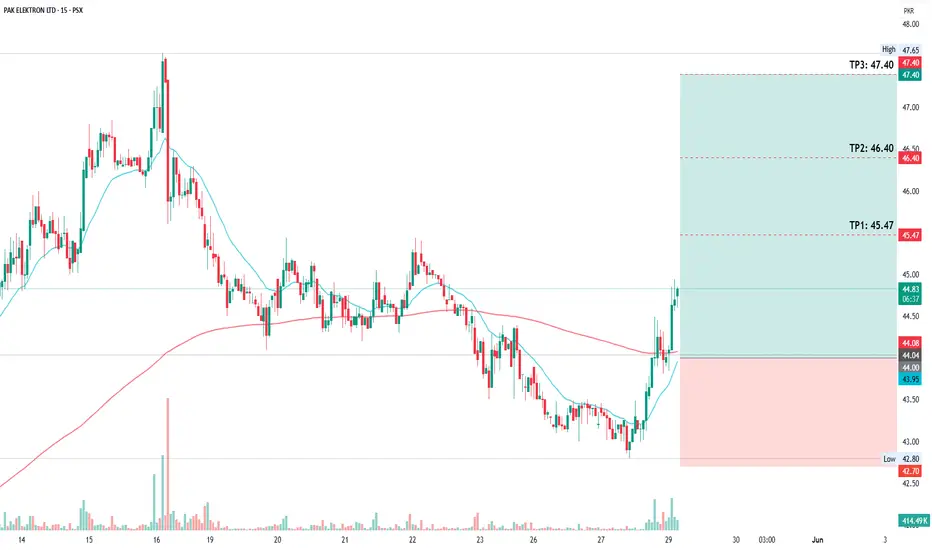
Bullish Breakout in PAEL: Buy on Dip for Short-Term GainsPAEL on the 15-minute timeframe shows a bullish setup with a recent breakout above the 20 EMA and 200 EMA, supported by a noticeable increase in volume—indicating strong buying interest. The current price is around PKR 44.70, and a "buy on dip" strategy is recommended within the 44.00–44.20 range. This setup offers a favorable risk-to-reward ratio, with a stop-loss placed at PkR42.70 and three take-profit targets at PkR 45.47, 46.40, and 47.40. The price has rebounded strongly from the recent low of 42.80, forming a potential trend reversal. Traders should monitor the 44.00 support zone closely, as a sustained hold above it could confirm the continuation toward higher targets.
TELE | Bullish Trend200-day EMA breakout and retest observed, expecting massive bullish rally on daily timeframe✅
Expected Target 9.35 in coming days🎯🚀

HINO LONG TRADEHINO is in uptrend since Sep 2023. Then it entered Wyckoff Re-Accumulation Phase from Feb 2024 till Nov 2024. It broke out of this Re-Accumulation Phase with asserted Volume Gradient in Dec 2024-made a high of 545 and started trading in a downward channel which is a bull flag as per price action principles. It also retested the Breakout at the OB causing the Breakout, made a SPRG at newly established support level and plotted HH and HL. With all above aspects factored in, we foresee an impending up move.
🚨 TECHNICAL BUY CALL – HINO 🚨
🎯 BUY ZONE: Rs. 390-410
📈 TP1 : Rs. 440
📈 TP2 : Rs. 466
🛑 STOP LOSS: BELOW Rs. 368 (Daily Close)
📊 RISK-REWARD: High Conviction | 1:3
Caution: Please buy in 3 parts in buying range. Close at least 50% position size at TP1 and then trail SL to avoid losing incurred profits in case of unforeseen market conditions.
PLEASE BOOST AND SHARE THE IDEA IF YOU FIND IT HELPFUL.
