Bearish Divergence has started appearing on Monthly tf.SAZEW
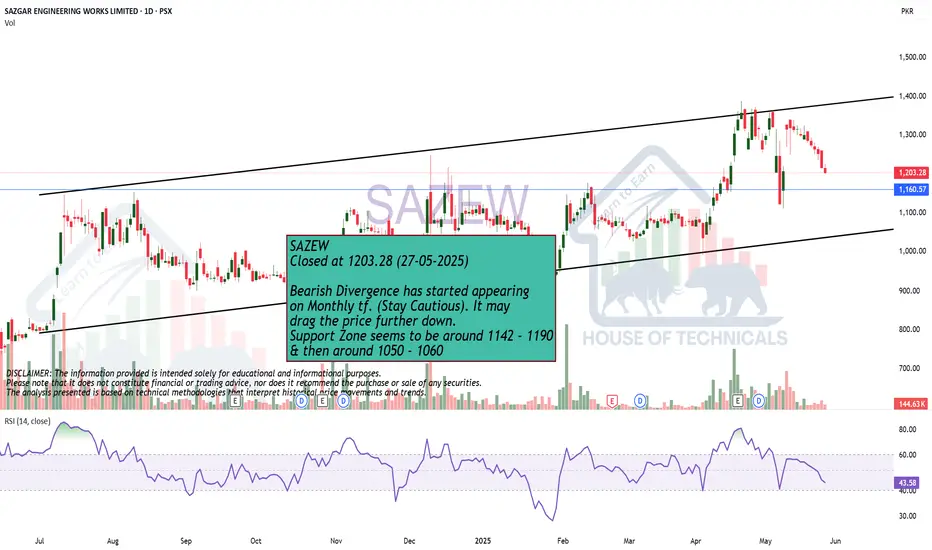
Closed at 1203.28 (27-05-2025)
Bearish Divergence has started appearing
on Monthly tf. (Stay Cautious). It may
drag the price further down.
Support Zone seems to be around 1142 - 1190
& then around 1050 - 1060
Hidden Bullish Divergence on Bigger tf.IMAGE
Closed at 21.94 (27-05-2025)
Hidden Bullish Divergence on Bigger tf.
Monthly Closing above 20.70 will be a
positive sign.
Upside Targets can be around 26 - 26.50
On the flip side, 20.50 - 20.68 is a Good
Support zone and then around 19.
Should not break 17.30, otherwise we may
witness nd Reversal.

NBP LONG TRADENBP is in uptrend since long and trading in an upward channel. Recently it made a scallop and gave a massive breakout, making a high of 99.96. Currently, it is in process of retesting its breakout level to resume the uptrend.
TECHNICAL BUY CALL– NBP
BUY1 : Rs. 92.79
BUY2 : Rs. 91.11
BUY3 : Rs. 89
📈 TP1 : Rs. 99.9
📈 TP2 : Rs. 108
STOP LOSS: BELOW Rs. 85 (Daily Close)
📊 RISK-REWARD: Medium Conviction | 1:2.63
Caution: Close at least 50% position size at TP1 and then trail SL to avoid losing incurred profits in case of unforeseen market conditions.
PLEASE BOOST AND SHARE THE IDEA IF YOU FIND IT HELPFUL.

SAIF TEXTILE UNORTHODOX BUY TRADE (For Advanced Traders)SAIF was previously in downtrend – then it showed reversal and has been trending in a Megaphone formation since May 2023. It has performed a liquidity sweep by moving below the megaphone formation, hitting the Bulling POI and sharply reversing upward with supportive Volume Gradient. It is currently in a pullback in spike phase of uptrend. Pull backs in this kind of spike phases are usually shallow and brief. Therefore, it is wise/profitable to accumulate SAIF at Current Price (CP) and close of each 1D candle – till it crosses 14.2. Profit Taking should be at the culmination of next up-leg.
🚨 TECHNICAL BUY TRADE– SAIF 🚨
🎯 BUY STRATEGY: Buy @ CP (13.09) and close of every 1D candle till it reaches 14.2
📈 TP1 : Rs. 14.2
📈 TP2 : Rs. 15
📈 TP3 : Rs. 17.4
🛑 STOP LOSS: BELOW Rs. 8 (Daily Close)
📊 RISK-REWARD: High Conviction | 1:3.8
Caution: Close at least 50% position size at TP1 and then trail SL to avoid losing incurred profits in case of unforeseen market conditions.
PLEASE BOOST AND SHARE THE IDEA IF YOU FIND IT HELPFUL.

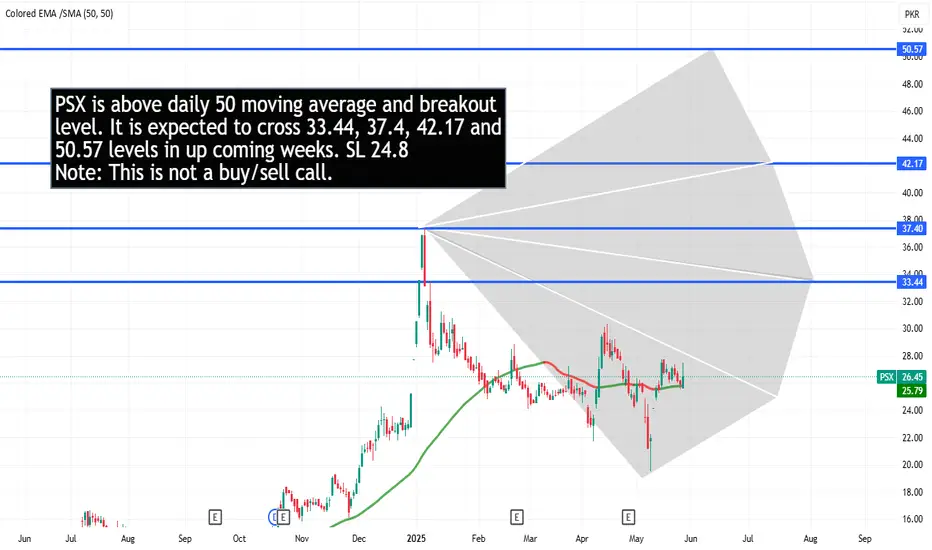
PSX is ready to flyPSX is above daily 50 moving average and breakout level. It is expected to cross 33.44, 37.4, 42.17 and 50.57 levels in up coming weeks. SL 24.8
Note: This is not a buy/sell call.
SSGC is near breakout level. SSGC is near to daily 50 moving average at (37.22) and it is breakout level too. It is expected to cross 51 and 64.7 level in few weeks. SL is 31.9
Note: This is not a buy/sell trade call.

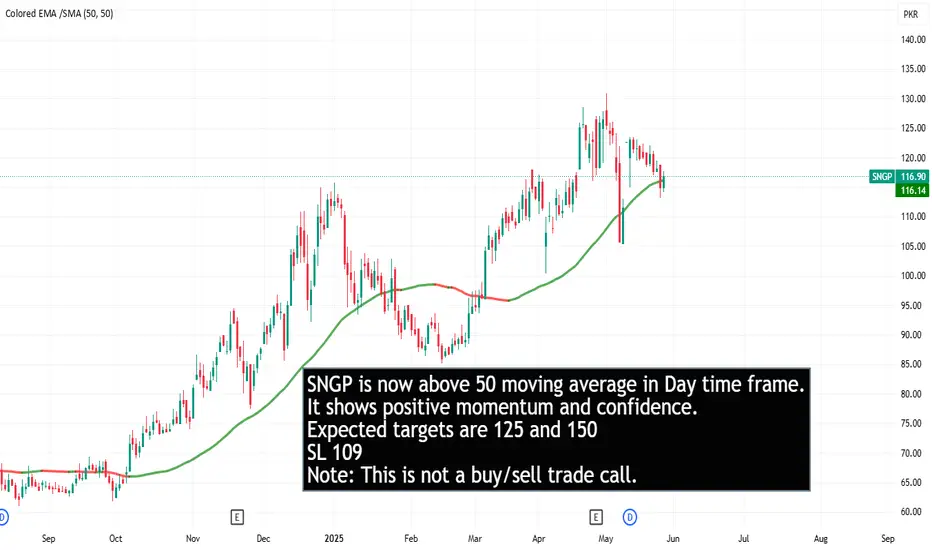
SNGP is ready to fly. SNGP is now above 50 moving average in Day time frame. It shows positive momentum and confidence. Expected targets are 125 and 150
SL 109
Note: This is not a buy/sell trade call.
HWQS could be a 5x to 10x stockHWQS breakout level is 10.55, It is expected to cross 50 and 100 level in next 6 to 18 months.
Note: This is not a buy/sell trade call.
Trade at your own will and use stop loss.

HH HL intact.FLYNG Closed at 50.80 (25-05-2025)
HH HL intact.
No Bearish Divergence yet on bigger tf.
54- 56 is the resistance for now.
If this level is crossed with Good Volumes,
we may witness further New Highs around 60+
On the flip side, 49 - 49.50 & then 47 - 47.50
may act as Good Support Levels.
However, breaking 45 will bring more Selling Pressure
towards 42 - 44

MARI Trade Idea1- Price is in uptrend and HH/HL are intact.
2- Price is stalling within golden pocket zone.
3- Price squeezing in between wedge pattern.
4- RSI on weekly @ 52 and monthly @ 66 which
is showing that bullish momentum is intact.
5- We need to wait for bullish candlestick pattern
within GP or breakout of the wedge pattern.
.

Though Still Bullish on Bigger tf, butPPL
Closed at 169.04 (23-05-2025)
Though Still Bullish on Bigger tf, but
Currently, resisted & closed around an
Important Resistance level around 169-170
Important Support level seems to be around 138 - 143

GWLC - PSX - SWING Trading Technical Analysis - Harmonic PatternOn Monthly TF, two harmonic patterns have been drawn. Gartley (94% complying) and Butterfly (88% complying).
In this bull run prices are moving way to fast. And due to market sentiments Bulls are in control. In normal bull run Gartley pattern will be complied before price drops but chances are that price will make new All Time High and follow Butterfly.
RSI is around 80 without any sign of reversal; however, minor retracements are normal but overall price will stay in up trend.
LONG Buy Trade Call
Buy-1 : 50.78
Buy-2 : 61.00
SL: 39.00
TP1: 57
TP2: 78

SAIF LONG TRADE (SAIF TEXTILE)SAIF was previously in downtrend – then it showed reversal and has been trending in a Megaphone formation since May 2023. It has performed a liquidity sweep by moving below the megaphone formation, hitting the Bulling POI and sharply reversing upward with supportive Volume Gradient. Buying on pullback is recommended.
🚨 TECHNICAL BUY CALL – SAIF 🚨
🎯 BUY ZONE: Rs. 10-11.6
📈 TP1 : Rs. 15.0
📈 TP2 : Rs. 17.4
🛑 STOP LOSS: BELOW Rs. 8 (Daily Close)
📊 RISK-REWARD: High Conviction | 1:3.8
Caution: Please enter/exit in 3 parts in give range. Close at least 50% position size at TP1 and then trail SL to avoid losing incurred profits in case of unforeseen market conditions.
PLEASE BOOST AND SHARE THE IDEA IF YOU FIND IT HELPFUL.

MACFL LONG TRADEMACFL was previously in uptrend – afterwards it has been trading in a downward corrective channel from Dec 2023 till April 2025. It has showed strong reversal signs; price trading above EMA-20 and Bullish FVG on 1D TF along with supportive Volume Gradient.
🚨 TECHNICAL BUY CALL – MACFL 🚨
🎯 BUY MACFL: Rs. 16.6-15.7
📈 TP1 : Rs. 18
📈 TP2 : Rs. 20.5
📈 TP3 : Rs. 22.5
🛑 STOP LOSS: BELOW Rs. 14.6 (Daily Close)
📊 RISK-REWARD: High Conviction | 1:3.3
Caution: Please enter/exit in 3 parts in give range. Close at least 50% position size at TP1 and then trail SL to avoid losing incurred profits in case of unforeseen market conditions.
PLEASE BOOST AND SHARE THE IDEA IF YOU FIND IT HELPFUL.

PIOC SHORT-SELL/EXIT CALLPIOC has been in an uptrend since Jan 2023. It made a Scallop formation and gave breakout from that formation in March 2024. It has exactly achieved the target price as projected by measured move. (TP 236), It has now formed a double top with right top lower than the left top. Though targets from the measured move projection of double top are much bigger, but those will be shared at later stage.
🚨 TECHNICAL SHORT-SELL/EXIT CALL – PIOC 🚨
🎯 SHORT-SELL/EXIT ZONE: Rs. 210-220
📈 TP1 : Rs. 195
📈 TP2 : Rs. 175
🛑 STOP LOSS: ABOVE Rs. 234 (Daily Close)
NOTE – Prices are of ready market
📊 RISK-REWARD: Medium Conviction | 1:2.7
Caution: Please enter/exit in 3 parts in give range. Close at least 50% position size at TP1 and then trail SL to avoid losing incurred profits in case of unforeseen market conditions.
PLEASE BOOST AND SHARE THE IDEA IF YOU FIND IT HELPFUL.

TOMCL SHORT SELL/EXIT TRADETOMCL was previously in an uptrend from Feb 2024 to Aug 2024. Then it switched to WYCKOFF Distribution Phase till April 2025. It broke down from the Distribution Phase and now has retested the break down level and confirmed downward reversal/rejection.
🚨 TECHNICAL SHORT-SELL/EXIT CALL – TOMCL 🚨
🎯 SHORT-SELL/EXIT ZONE: Rs. 31-33
📈 TP1 : Rs. 28.5
📈 TP2 : Rs. 25.1
🛑 STOP LOSS: ABOVE Rs. 34.6 (Daily Close)
NOTE – Prices are of ready market
📊 RISK-REWARD: High Conviction | 1:3
Caution: Please enter/exit in 3 parts in give range. Close at least 50% position size at TP1 and then trail SL to avoid losing incurred profits in case of unforeseen market conditions.
PLEASE BOOST AND SHARE THE IDEA IF YOU FIND IT HELPFUL.

FLYING SHORT-SELL/EXIT CALLFLYING was previously in Accumulation Phase from Jan 2025 till April 2025 – It broke out of this phase and plotted a high of 56, with remarkable Volume Distribution. It has completed Elliot Waves 1-2-3-4-5 of uptrend. In last up-wave, it has gone through SOT and variation in Volume Gradient. These factors suggest an impending corrective wave A-B-c in coming days.
🚨 TECHNICAL SHORT-SELL/EXIT CALL – FLYING 🚨
🎯 SHORT-SELL/EXIT ZONE: Rs. 54-50.1
📈 TP1 : Rs. 45.9
📈 TP2 : Rs. 38.7
🛑 STOP LOSS: ABOVE Rs. 57.5 (Daily Close)
NOTE – Prices are of ready market
📊 RISK-REWARD: Medium Conviction | 1:2.34
Caution: Please enter/exit in 3 parts in give range. Close at least 50% position size at TP1 and then trail SL to avoid losing incurred profits in case of unforeseen market conditions.
PLEASE BOOST AND SHARE THE IDEA IF YOU FIND IT HELPFUL.

FFL SHORT-SELL/EXIT FOLLOW UP TRADE (FRESH ENTRY)FFL has been repeatedly rejected from POI between 15.7-16.7. It has once again reversed from the same level with bigger Volumes.
🚨 TECHNICAL SHORT-SELL/EXIT CALL – FFL🚨
🎯 SHORT-SELL/EXIT ZONE: Rs. 15.5-16.1
📈 TP1 : Rs. 13.9
📈 TP2 : Rs. 11.7
🛑 STOP LOSS: ABOVE Rs. 16.7(Daily Close)
NOTE – Prices are of ready market
📊 RISK-REWARD: High Conviction | 1:3.8
Caution: Please enter/exit in 3 parts in give range. Close at least 50% position size at TP1 and then trail SL to avoid losing incurred profits in case of unforeseen market conditions.
PLEASE BOOST AND SHARE THE IDEA IF YOU FIND IT HELPFUL.

CHCC FOLLOW-UP SHORT-SELL/EXIT TRADE (FRESH ENTRY)CHCC has been trading in Downtrend perfect channel since Dec 2024.
Downward Volume Gradient on down waves have been on higher side than up waves.
It has once again been rejected by Supply Zone at the top of the Channel.
This whole scenario makes CHCC High Probability Short Trade.
🚨 TECHNICAL SHORT-SELL/EXIT CALL – CHCC 🚨
🎯 SHORT-SELL/EXIT ZONE: Rs. 270-260
📈 TP1 : Rs. 250
📈 TP2 : Rs. 222
🛑 STOP LOSS: ABOVE Rs. 285 (Daily Close)
NOTE – Prices are of ready market
📊 RISK-REWARD: High Conviction | 1:3.3
Caution: Please enter/exit in 3 parts in give range. Close at least 50% position size at TP1 and then trail SL to avoid losing incurred profits in case of unforeseen market conditions.
PLEASE BOOST AND SHARE THE IDEA IF YOU FIND IT HELPFUL.

AVN SHORT-SELL/EXIT FOLLOW-UP TRADE (FRESH ENTRY)AVN is trending in a downward channel. After posting a healthy pull-back, AVN has been rejected from Breaker Block.
🚨 TECHNICAL SHORT SELL/EXIT CALL –AVN 🚨
🎯 SHORT-SELL/EXIT ZONE: Rs. 48.3-51
📈 TP1 : Rs. 45.1
📈 TP2 : Rs. 41.1
🛑 STOP LOSS: ABOVE Rs. 53.7(Daily Close)
NOTE – Prices are of ready market
📊 RISK-REWARD: Medium Conviction | 1:2.75
Caution: Please enter/exit in 3 parts in give range. Close at least 50% position size at TP1 and then trail SL to avoid losing incurred profits in case of unforeseen market conditions.
PLEASE BOOST AND SHARE THE IDEA IF YOU FIND IT HELPFUL.

TELECARD breakout on daily chartsTELECARD is rising on daily charts, good chance for buying at current levels

TCORP INVERSE H&S PATTERN; TG 20 -22📈 TCORP (Tariq Corporation Ltd – Hussein Sugar)
TCORP has triggered a classic bullish reversal pattern with a clear breakout from an Inverse Head & Shoulders formation on the daily chart. After forming a solid base with the Left Shoulder, Head, and Right Shoulder, the price has now convincingly broken above the neckline near PKR 14.80–15.00, confirming the pattern.
The current breakout candle, closing at PKR 15.30 with a gain of +5.15%, is backed by improving volume—adding strength to the bullish case. This pattern generally suggests a trend reversal from downtrend to uptrend, and based on the measured move from the head to the neckline, the projected target lies between 21–22, as indicated on the chart.
As long as the price sustains above the neckline zone (now turned support), this setup remains active and valid. A short-term retest of the breakout zone could offer a potential entry point for late movers, while momentum traders may look to ride the trend up to the target area.
In summary, TCORP is showing strong technical momentum after confirming a textbook reversal pattern. With a well-defined structure and upside target in sight, the stock looks poised for a potential move toward 21–22 in the coming sessions.

