DGKC LongRespecting its upward channel.
Immediate resistance at ~142.
Next target will be Fib 1.618 level i.e. ~204.
Immediate supports at 118 and 108


AIRLINK LONG TRADEAIRLINK was in WYCKOFF Re-Accumulation Phase from Aug 2024 to Nov 2024 and broke out from it with supportive Vol Distribution reaching a high of 228. It then started trending in a corrective downward channel (which is actually a Bull Flag). It also has completed three pushes to channel bottom and then gave Selling Climax by breaking through the channel bottom. It has recently created SPRG on major support level. Now it’s reversal is supported by Volume Distribution as well as it crossing over EMA-20 on 1D TF.
🚨 TECHNICAL BUY CALL – AIRLINK 🚨
🎯 BUY ZONE: Rs. 156-160
📈 TP1 : Rs. 172
📈 TP2 : Rs. 182
📈 TP3 : Rs. 190.5
📈 TP4 : Rs. 203.5
🛑 STOP LOSS: BELOW Rs. 146 (Daily Close)
📊 RISK-REWARD: High Conviction | 1:4.5
Caution: Please buy in 3 parts in buying range. Close at least 50% position size at TP1 and then trail SL to avoid losing incurred profits in case of unforeseen market conditions.
PLEASE BOOST THE IDEA IF YOU FIND IT HELPFUL.

SYM LONG TRADESYM was in WYCKOFF Accumulation Phase from Sep 2024 to Nov 2024 and broke out from it with supportive Vol Distribution reaching a high of 22. It then started trending in a corrective downward channel and has recently re-tested its breakout level, creating a SPRG on breakout axis line. Now it’s reversal is supported by Volume Distribution as well as it crossing over EMA-20 on 1D TF.
🚨 TECHNICAL BUY CALL – SYM 🚨
🎯 BUY ZONE: Rs. 13.9-15
📈 TP1 : Rs. 17
📈 TP2 : Rs. 19.14
📈 TP3 : Rs. 21.2
🛑 STOP LOSS: BELOW Rs. 11.9 (Daily Close)
📊 RISK-REWARD: Medium Conviction | 1:2.5
Caution: Please buy in 3 parts in buying range. Close at least 50% position size at TP1 and then trail SL to avoid losing incurred profits in case of unforeseen market conditions.
PLEASE BOOST THE IDEA IF YOU FIND IT HELPFUL.

EPQL LONG TRADEEPQL was previously in downtrend, then it switched to WYCKOFF Accumulation Phase from Oct 2024 to March 2025. Then it broke out of this accumulation phase with supportive volume distribution. Recently, it has retraced back to the Demand Zone which caused the breakout. It is ready to resume its ascend.
🚨 TECHNICAL BUY CALL – EPQL🚨
🎯 BUY ZONE: Rs. 26-28
📈 TP1 : Rs. 34.8
📈 TP2 : Rs. 41.6
🛑 STOP LOSS: BELOW Rs. 24.5 (Daily Close)
📊 RISK-REWARD: High Conviction | 1:5.8
Caution: Please buy in 3 parts in buying range. Close at least 50% position size at TP1 and then trail SL to avoid losing incurred profits in case of unforeseen market conditions.
PLEASE BOOST THE IDEA IF YOU FIND IT HELPFUL.

ILP LONG TRADEILP was in a bear channel since May 2024. As per price action principles, Bear Channel Is a Bull Flag. It completed three downward pushes towards channel bottom, and broke down from channel bottom showing Selling Climax, which is a warning of Trend Reversal. It has displayed reversal with supportive volume distribution and plotted a higher low. Also it has crossed above EMA-20 on 1D TF.
🚨 TECHNICAL BUY CALL – ILP🚨
🎯 BUY ZONE: Rs. 55-59
📈 TP : Rs. 64
📈 TP : Rs. 79
🛑 STOP LOSS: BELOW Rs. 52(Daily Close)
📊 RISK-REWARD: High Conviction | 1:5
Caution: Please buy in 3 parts in buying range. Close at least 50% position size at TP1 and then trail SL to avoid losing incurred profits in case of unforeseen market conditions.
PLEASE BOOST THE IDEA IF YOU FIND IT HELPFUL.

CLOV LONG TRADECLOV was in WYCKOFF accumulation phase and broke out from the consolidation with heavy volumes. Soon it retested breakout point but remained range bound for quite some time. Recently, it retouched the retest level, forming a SPRG and showed reversal, backed by heavy volumes.
🚨 TECHNICAL BUY CALL – CLOV🚨
🎯 BUY ZONE: Rs. 38-41
📈 TP : Rs. 46
🛑 STOP LOSS: BELOW Rs 34.5 (Daily Close)
📊 RISK-REWARD: Medium Conviction | 1:2.4
Caution: Please buy in 3 parts in buying range. Close at least 50% position size at TP1 and then trail SL to to avoid losing incurred profits in case of unforeseen market conditions.
PLEASE BOOST THE IDEA IF YOU FIND IT HELPFUL.

SYS (SYSTEMS LTD) LONG TRADESYS was in WYCKOFF re-accumulation zone from Jan 2023 to Oct 2024 - then it broke out of this re-accumulation zone and recently it has retested the breakout level and created a spring across the axis line as marked in the chart. The retest has been in a downward channel – it has broken out of this downward channel and created a higher low. Along with other factors, Volume distribution analysis supports this upward move.
🚨 TECHNICAL BUY CALL – SYS🚨
🎯 BUY ZONE: Rs. 530-560
📈 TP1 : Rs. 585
📈 TP2 : Rs. 610
📈 TP3 : Rs. 645
🛑 STOP LOSS: BELOW Rs. 505 (Daily Close)
📊 RISK-REWARD: High Conviction | 1: 3.1
Caution: Please close at least 50% position size at TP1 and then follow strict trailing SL to avoid losing incurred profits in case of unforeseen market conditions
PLEASE BOOST THE IDEA IF YOU FIND IT HELPFUL.

GGGL LONG TRADEGGGL was previously in downtrend - then it went into WYCKOFF accumulation zone for 2 years and broken out from that in last Dec. It successfully retested that breakout twice, and now has made a SPRG at that important support level. Also, it made a bullish breaker block, which is a very safe place to enter this trade. It is now in a Double Bottom Bullish Flag Pattern, which is a precursor to upward move.
🚨 TECHNICAL BUY CALL –GGGL 🚨
🎯 BUY ZONE: Rs. 9.2-9.6
📈 TP1 : Rs. 10.7
📈 TP2 : Rs. 12.0
🛑 STOP LOSS: BELOW Rs. 8.7 (Daily Close)
📊 RISK-REWARD: High Conviction | 1:3.6
Caution: Please close at least 50% position size at TP1 and then follow strict trailing SL to avoid losing incurred profits in case of unforeseen market conditions
PLEASE BOOST THE IDEA IF YOU FIND IT HELPFUL

AKBL LONG TRADEAKBL is in uptrend since long; it was in WYCKOFF re-accumulation phase since Nov 2025 till May 2025. It has recently broken out from that re- accumulation phase with supportive volumes distribution, forming a strong bullish breaker block.
🚨 TECHNICAL BUY CALL –AKBL 🚨
🎯 BUY ZONE: Rs. 45-48
📈 TP1 : Rs. 52
📈 TP2 : Rs. 56.5
🛑 STOP LOSS: BELOW Rs. 42.5 (Daily Close)
📊 RISK-REWARD: High Conviction | 1:3
Caution: Please close at least 50% position size at TP1 and then follow strict trailing SL to avoid losing incurred profits in case of unforeseen market conditions
PLEASE BOOST THE IDEA IF YOU FIND IT HELPFUL.

YOUW LONG TRADEYOUW was in downtrend since Aug 2024 till start of Nov 2024. It completed last portion of its downtrend in a downward channel as seen in chart; and completed WYCKOFF accumulation events of PS - AR - WYCKOFF accumulation – ST – SPRG. It shows reversal now backed by VSA.
🚨 TECHNICAL BUY CALL –YOUW 🚨
🎯 BUY ZONE: Rs. 3.5-3.8
📈 TP1 : Rs. 4.2
📈 TP2 : Rs. 4.7
📈 TP3 : Rs. 5.4
🛑 STOP LOSS: BELOW Rs. 2.9 (Daily Close)
📊 RISK-REWARD: High Conviction | 1:3.15
Caution: Please close at least 50% position size at TP1 and then follow strict trailing SL to avoid losing incurred profits in case of unforeseen market conditions
PLEASE BOOST THE IDEA IF YOU FIND IT HELPFUL.

WAVWSAPP LONG TRADE
WAVESAPP was in downtrend since December 2024 till start of May 2024. It completed last portion of its downtrend in a downward channel as seen in chart; now it has broken out of this downward channel with supported by VSA (Volume Spread Analysis).
🚨 TECHNICAL BUY CALL – WAVESAPP 🚨
🎯 BUY ZONE- Rs. 9.3-9.9
📈 TP1 : Rs. 11
📈 TP2 : Rs. 12
📈 TP3: Rs. 12.95
🛑 STOP LOSS: BELOW Rs. 8.4 (Daily Close)
📊 RISK-REWARD: High Conviction | 1:3.5
Caution: Please close at least 50% position size at TP1 and then follow strict trailing SL to avoid losing incurred profits in case of unforeseen market conditions
PLEASE BOOST THE IDEA IF YOU FIND IT HELPFUL.

CYAN LONG TRADECYAN was in downtrend since Aug 2021 till June 2023. Following that, it started trending in upward channel and recently it took support from its weekly FVG and rebounded. This is a different trade; it has to be accumulated in buying zone.
🚨 TECHNICAL BUY CALL – CYAN 🚨
🎯 ACCUMULATE - Rs. 26.5-29.5
📈 TP1 : Rs. 34.8
📈 TP1 : Rs. 39.8
🛑 STOP LOSS: BELOW Rs. 22 (Daily Close)
📊 RISK-REWARD: Medium Conviction | 1:2.8
Caution: Please close at least 50% position size at TP1 and then follow strict trailing SL to avoid losing incurred profits in case of unforeseen market conditions
PLEASE BOOST THE IDEA IF YOU FIND IT HELPFUL.

LOADS LONG TRADE LOADS was in WYCKOFF accumulation from July 2022 to April 2024; gave breakout and went into re-accumulation and gave breakout from that – Now it has retest the second breakout on axis line and rebound. It has posted a higher low and volumes support the upward move.
🚨 TECHNICAL BUY CALL – LOADS 🚨
🎯 BUY ZONE: Rs. 13.2-14.2
📈 TP1 : Rs. 17.7
📈 TP2 : Rs. 19.9
📈 TP3 : Rs. 24.4 (Longterm)
🛑 STOP LOSS: BELOW Rs 11.80 (Daily Close)
📊 RISK-REWARD: High Conviction | 1:4.5
Caution: Please close at least 50% position size at TP1 and then follow strict trailing SL to avoid losing incurred profits in case of unforeseen market conditions
PLEASE BOOST THE IDEA IF YOU FIND IT HELPFUL.

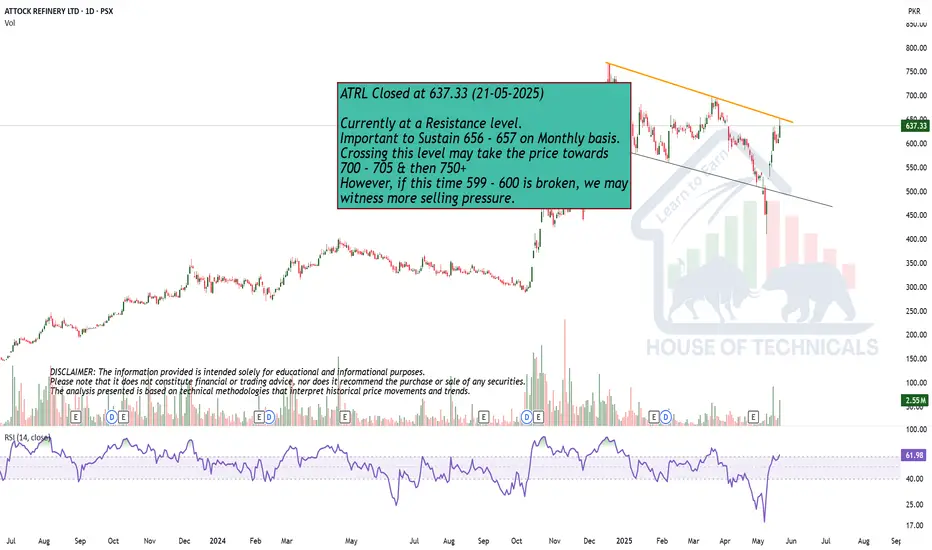
Currently at a Resistance level.ATRL Closed at 637.33 (21-05-2025)
Currently at a Resistance level.
Important to Sustain 656 - 657 on Monthly basis.
Crossing this level may take the price towards
700 - 705 & then 750+
However, if this time 599 - 600 is broken, we may
witness more selling pressure.
Bullish Setup
Closed at 141.02 (21-05-2025)
Beautiful Bullish Divergence +
Inverse H&S in progress.
As mentioned earlier, 144 - 146 is
an immediate resistance; once crossed
& sustained, we may witness 152 - 155
& then 175 - 180.

Beautiful SetupClosed at 141.02 (21-02-2025)
Beautiful Bullish Divergence +
Inverse H&S in progress.
As mentioned earlier, 144 - 146 is
an immediate resistance; once crossed
& sustained, we may witness 152 - 155
& then 175 - 180.

Bullish
Closed at 34.03 (21-05-2025)
Hidden Bullish Divergence on bigger tf.
Bullish Divergence on shorter tf.
Immediate resistance is around 34 - 34.10
Crossing & Sustaining this level may exposes
upside towards 47 - 48
However, mid way, 40-41 & 44-45 are important
resistances that should not be ignored.
On the flip side, 30 - 32 are important Support levels.
and 29.80 Must not Break on Monthly Basis.

ITTEFAQ LONG TRADEITTEFAQ was in Downtrend from Jun 2021 till March 2023.
Then it went though Wyckoff Accumulation Phase till Jan 2025 resulting in Change of Character(CHoCH) to Bullish Side and posted a High of 10.05.
Afterwards, it went correction/pullback.
It has recently displayed signs of commencement of Bullish Trend which is confirmed by following:
1. Crossed above 1D 20 EMA and Major Axis Line
2. Posted a Higher Low
3. Evidently Heavier Wave Volumes Distribution on Up leg so far
🚨 TECHNICAL BUY CALL – ITTEFAQ🚨
🎯 BUY ZONE: Rs. 7.00-7.50
📈 TP1 : Rs. 9.70
📈 TP2 : Rs.11.80
🛑 STOP LOSS: BELOW Rs 5.50 (Daily Close)
📊 RISK-REWARD: High Conviction | 1:3.5
Caution: Please close at least 50% position size at TP1 and then follow strict trailing SL to avoid losing incurred profits in case of unforeseen market conditions
PLEASE BOOST THE IDEA IF YOU FIND IT HELPFUL.

SPEL LONG TRADESPEL was in uptrend in July and August 2024, and took A-B-C correction. It has been in WYCKOFF re-accumulation since October 2024. Now it has indicated starting of a new upward move because:
a. Breaker block formation on 1D TF.
b. Shifting of volumes
c. The targets have been calculated on measured move method.
🚨 TECHNICAL BUY CALL – SPEL 🚨
🎯 BUY ZONE: Rs. 40.7-43.4
📈 TP1 : Rs. 51.8
📈 TP2 : Rs. 57.3
🛑 STOP LOSS: BELOW Rs. 39 (Daily Close)
📊 RISK-REWARD: High Conviction | 1: 3.3
Caution: Please close at least 50% position size at TP1 and then follow strict trailing SL to avoid losing incurred profits in case of unforeseen market conditions
PLEASE BOOST THE IDEA IF YOU FIND IT HELPFUL.

UNITY LONG TRADE (SWING & LONGTERM)UNITY is in uptrend since May 2023, which is shown in yellow channel on the chart. Present pullback/corrective phase started from Dec 2024 (blue channel). This downward corrective leg has culminated through making a spring below axis line. Volume distribution backs the resumption of uptrend.
🚨 TECHNICAL BUY CALL – UNITY 🚨
🎯 BUY ZONE: Rs. 25-27
📈 TP1 : Rs. 29.4
📈 TP2 : Rs. 32.8
📈 TP3 : Rs. 35.1 (LONGTERM)
📈 TP2 : Rs. 37.4 (LONGTERM)
🛑 STOP LOSS: BELOW Rs. 22 (Daily Close)
📊 RISK-REWARD: High Conviction | 1: 4
Caution: Please close at least 50% position size at TP1 and then follow strict trailing SL to avoid losing incurred profits in case of unforeseen market conditions
PLEASE BOOST THE IDEA IF YOU FIND IT HELPFUL.

PRL LONG TRADEPRL spent around six months in accumulation, leading to a breakout in December 2024 that pushed the stock to an all-time high (ATH) of PKR 45.86. Post-breakout, the stock entered a corrective descending channel, reflecting profit booking and temporary weakness.
Recently, PRL formed a spring (false breakdown below support), followed by a Bullish Hinge pattern, characterized by tightening price action and reduced volatility. These are strong signs of demand absorption and an imminent breakout, potentially marking the beginning of a trend reversal to the upside.
📌 Key Technical Highlights:
ATH: PKR 45.86 (Dec 2024)
Structure: Descending corrective channel
Spring Formation: Bullish deviation below support
Bullish Hinge: Volatility contraction before breakout
Breakout Signal: High-volume move above channel resistance
🚨 TECHNICAL BUY CALL – PRL 🚨
🎯 BUY ZONE: PKR 32 – 34
📈 TP1: PKR 38.50
📈 TP2: PKR 44.80
🛑 STOP LOSS: Below PKR 28.75 (Daily Close)
📊 RISK–REWARD: 1 : 3.3 | High Conviction
⚠️ Note: Book partial profits at TP1 and trail the rest to lock in gains as the move progresses.

NRL LONG/INVESTMENT TRADENRL was in Wyckoff accumulation. After making Automatic Rally,I t made a spring from the channel bottom. Additionally, it is narrowing at the apex of its triangle. Its reversal is confirmed as it:
1. Crossed above 1D 20 EMA
2. Posted a Higher Low
3. Made a 1H Bullish FVG
4. Much Heavier Volumes on Up leg so far
🚨 TECHNICAL BUY CALL – NRL🚨
🎯 BUY ZONE: Rs. 220-240 (BUY AFTER PULLBACK)
📈 TP1 : Rs. 302
📈 TP2 : Rs. 383
🛑 STOP LOSS: BELOW Rs. 182 (Daily Close)
📊 RISK-REWARD: High Conviction | 1:10
Caution: Please close at least 50% position size at TP1 and then follow strict trailing SL to avoid losing incurred profits in case of unforeseen market conditions
PLEASE BOOST THE IDEA IF YOU FIND IT HELPFUL.
