ACPL LONG TRADEACPL was in WYCKOFF Re-Accumulation Zone for FIVE months DEC 2024-APR 2025, giving breakout few days.
The pattern can be compared to Flag and Pole also.
Measured Move Targets show good risk to reward ratio.
Set-up is of High Probability as suggested by Advanced Volume Distribution Analysis
🚨 TECHNICAL BUY CALL –ATTOCK CEMENT PAKISTAN LTD (PSX: ACPL) 🚨
🎯 BUY ZONE: Rs. 300-310
📈 TP 1: Rs. 355
📈 TP 2: Rs. 380
🛑 STOP LOSS: BELOW Rs 280(Daily Close)
📊 RISK-REWARD: High Conviction | 1:3.75+
Caution:
Please close at least 50% position size at TP1 and then follow strict trailing SL to avoid losing incurred profits in case of unforeseen market conditions
PLEASE BOOST THE IDEA IF YOU FIND IT HELPFUL.

MFFL LONG TRADEMFFL was in WYCKOFF Re-Accumulation Zone for six months DEC 2023-NOV 2024, giving breakout in NOV 2024 and plotted a high of 329, followed by corrective downward channel. Currently, it has completed all requisite events like TOB (Test of Breakout), reversal/breakout from Downtrend Channel with heavy volumes.
🚨 TECHNICAL BUY CALL –MITCHELL'S FRUIT FORMS LTD (PSX: MFFL) 🚨
🎯 BUY ZONE: Rs. 180-190
📈 TP 1: Rs. 215
📈 TP 2: Rs. 244
🛑 STOP LOSS: BELOW Rs 160(Daily Close)
📊 RISK-REWARD: High Conviction | 1:2.8+
Caution:
Please close at least 50% position size at TP1 and then follow strict trailing SL to avoid losing incurred profits in case of unforeseen market conditions
PLEASE BOOST THE IDEA IF YOU FIND IT HELPFUL.

FCCL SHORTSELL TRADEFCCL been in uptrend since Sep 2023.
Recently it has gone through Buying Climax which shows entry of Late Emotional Buyers, there's no one left to buy. This scenario suggests distribution or downtrend/correction in coming days.
FCCL has also given Shortening of Thrust on the last up leg, which too suggests imminent downtrend/correction.
Volume Distribution Analysis also supports downfall in Buying Volumes
🚨 TECHNICAL SHORT SELL CALL –FCCL🚨
🎯 SHORTSELL ZONE : 47-49
📈 TP 1: Rs. 44.5
📈 TP2 : Rs. 42.1
📈 TP3 : Rs. 39.9
🛑 STOP LOSS: Above Rs. 51(Daily Close)
📊 RISK-REWARD: High Conviction | 1:5
Caution:
Please close at least 50% position size at TP1 and then follow strict trailing SL to avoid losing incurred profits in case of unforeseen market conditions
PLEASE BOOST THE IDEA IF YOU FIND IT HELPFUL.

AVN SHORT-SELL TRADEAVN been in DOWNTREND since Sep 2024.
Recent up leg has been mostly due to across the board Bullish Sentiments because of improvement in Geo Political Environment.
Current Up Move is also just a healthy Pullback in overall Downtrend.
There's strong Bearish Breaker Block overhead current levels which will obstruct any upward movement.
🚨 TECHNICAL SHORT SELL CALL –AVN 🚨
🎯 SHORTSELL ZONE : 52.2-50.2
📈 TP1 : Rs. 46.5
📈 TP2 : Rs. 41.2
🛑 STOP LOSS: Above Rs. 55 (Daily Close)
📊 RISK-REWARD: High Conviction | 1:3.8
Caution:
Please close at least 50% position size at TP1 and then follow strict trailing SL to avoid losing incurred profits in case of unforeseen market conditions
PLEASE BOOST THE IDEA IF YOU FIND IT HELPFUL.

OCTOPUS SHORTSELLTRADEOCTOPUS been in DOWNTREND since Sep 2024.
Recent up leg has been mostly due to across the board Bullish Sentiments because of improvement in Geo Political Environment.
Current Up Move is also just a healthy Pullback in overall Downtrend.
There's strong Bearish Breaker Block overhead current levels which will obstruct any upward movement.
🚨 TECHNICAL SHORT SELL CALL –OCTOPUS🚨
🎯 SHORTSELL ZONE : 53-56
📈 TP 1: Rs. 47
📈 TP2 : Rs. 38
🛑 STOP LOSS: Above Rs. 60 (Daily Close)
📊 RISK-REWARD: High Conviction | 1:3.5
Caution:
Please close at least 50% position size at TP1 and then follow strict trailing SL to avoid losing incurred profits in case of unforeseen market conditions
PLEASE BOOST THE IDEA IF YOU FIND IT HELPFUL.

MLCF SHORT TRADEMLCF been in recent uptrend since Sep 2024.
It has gone through Buying Climax which shows entry of Late Emotional Buyers, there's no one left to buy. This scenario suggests distribution or downtrend/correction in coming days.
MLCF has also given Shortening of Thrust on the last up leg, which too suggests imminent downtrend/correction.
Volume Distribution Analysis also supports downfall in Buying Volumes
🚨 TECHNICAL SHORT SELL CALL –MLCF🚨
🎯 SHORTSELL ZONE : 73-76
📈 TP 1: Rs. 68
📈 TP2 : Rs. 62
🛑 STOP LOSS: Above Rs. 80 (Daily Close)
📊 RISK-REWARD: High Conviction | 1:4
Caution:
Please close at least 50% position size at TP1 and then follow strict trailing SL to avoid losing incurred profits in case of unforeseen market conditions

POWER SHORT TRADEPOWER has been in uptrend since NOV 2024.
It has now formed famous Three Symmetrical Peaks or Three Little Indians Pattern, which signifies upcoming downtrend.
Volume Spread Analysis also confirms the Bearish Scenario in coming days.
It seems to have no support before Breaker Block underneath at 12.2
🚨 TECHNICAL SHORT SELL CALL –POWER🚨
🎯 SHORTSELL ZONE : 14.5-15.5
📈 TP 1: Rs. 13.2
📈 TP2 : Rs. 12.2
🛑 STOP LOSS: Above Rs. 16 (Daily Close)
📊 RISK-REWARD: High Conviction | 1:3

BNL LONGTRADEBNL has completed two upward legs after breakout, it is highly likely to start its third and final leg before starting major correction.
It is expected to at least test recent high of 36 and may even exceed it
BNL buy 20-24
TP1 28
TP2 36
SL 18.9

TPLP Technical Analysis(Weekly): Potential Bullish SetupTPLP (TPL Properties Ltd) has recently bounced from a monthly support level, accompanied by a strong bullish closing on the weekly chart, indicating a good discount level for potential buyers. The price also took support from a downward trendline on the weekly timeframe. While we may or may not retest the Buy 2 level, there is a probability as it aligns with a daily gap-up level that price might look to fill. After Take Profit 2, there isn't significant major resistance, suggesting the potential for the price to reach Take Profit 3. It's truly a game of probabilities, and the odds here look compelling for upside!
Trading Recommendations:
Buy 1 (CMP): 9.14
Buy 2: 7.3
Stop-Loss Level: Closing below 6
Take Profit 1: 14.7
Take Profit 2: 20
Take Profit 3: 38.5
Happy trading!

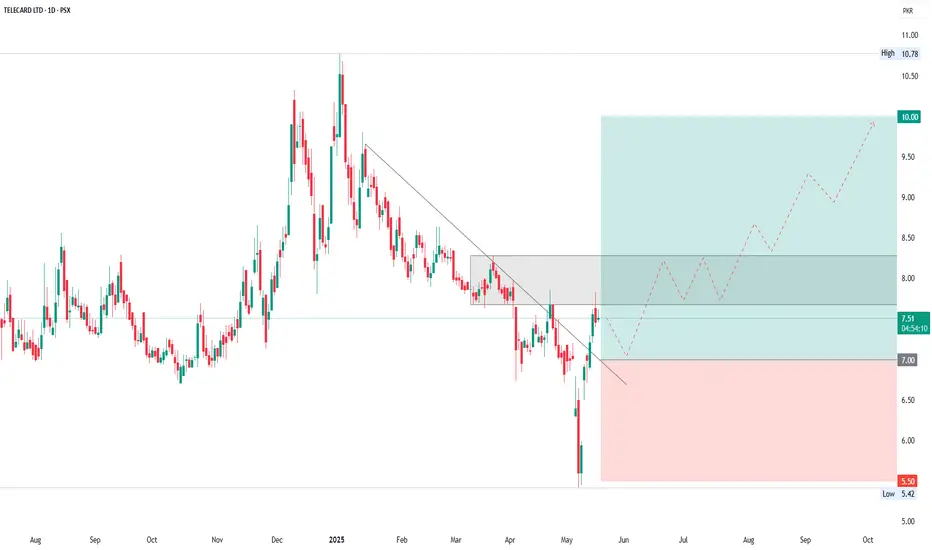
TELE Breakout: Bullish Momentum AheadThe chart shows a recent bullish breakout above a descending trendline, signaling a potential trend reversal after a prolonged downtrend. The price has moved above the resistance zone around 7 and is currently trading at 7.54. A projected bullish path is indicated with dotted red lines, targeting a future price of 10, suggesting investor optimism. The chart also outlines a risk management zone with a stop loss at 5.50, highlighting a favorable risk-reward ratio. This setup implies a bullish bias with potential consolidation around the 7.50–8.20 zone before any strong continuation upward. Expected final target towards 10 which is 42.86% gain from its entry point.
BNWM is above breakout levelBNWM is above breakout level of 32.95 and it is expected to cross 41 level.
SL is 29.57 and this is not a buy/sell trade call. It is an analysis. Trade at your own will.
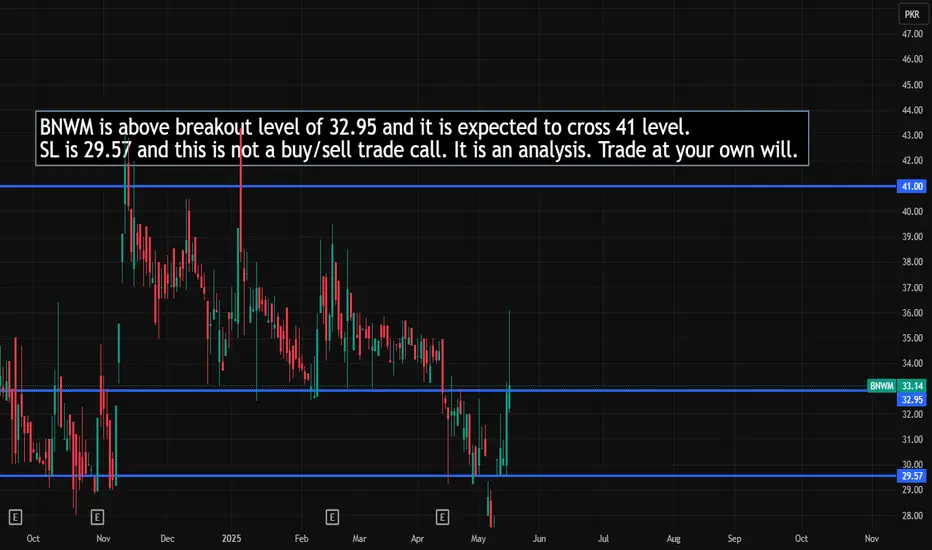
Possible Setup..Immediate Resistance is around 40 - 40.50
Crossing this level will take it to 42.50 - 43

BAPL Breakout: Ignites with 61% Weekly Surge; TP 56 - 69 - 77Bawany Air Products Ltd (BAPL) has delivered a powerful breakout on the weekly chart, surging by an impressive 61.09% to close at 44.17 as of May 18, 2025. This move marks a clear breakout from a long-standing descending triangle pattern, signaling a shift from a consolidation phase to a fresh bullish trend. The breakout is technically significant and suggests strong buying interest and renewed momentum in the stock.
Using Fibonacci retracement levels from the prior swing high of 56.82 to the low of 22.30, BAPL has already surpassed the critical 61.8% level at 44.06. This opens the path toward the next resistance levels at 49.25 (78.6%) and 56.82 (100%). Beyond that, Fibonacci extension levels suggest medium-term targets at 64.48, 69.62, and even 77.78, indicating the potential for a multi-leg rally if the momentum sustains.
The Stochastic RSI is also supporting the bullish case, with both lines rising strongly—green at 61.93 and red at 57.23—indicating continued upward momentum. Immediate support lies around 40.00, while deeper support is near 35.40, both of which could serve as buy-on-dip zones. In summary, BAPL appears to be entering a high-momentum phase, with short-term targets in the 49–57 range and higher upside possible as long as key support levels hold.


SEARLSEARL short swing
Buy on dip still facing rejection from top of downtrend line
buying levels mention


NRSL LONG TRADENRSL was in WYCKOFF Accumulation Zone from Jan-Mar 2025, giving breakout in Apr 2025 and plotted a high of 48.70, followed by corrective downward channel. Currently, it has completed all requisite events like TOB (Test Of Breakout), reversal and BO from the downward channel.
Volume Distribution and Profile supports the impending uptrend.
Chemicals will be one of sectors to perform exceptionally in pre-budget rally.
🚨 TECHNICAL BUY CALL –Nimir Resins Ltd (PSX: NRSL) 🚨
🎯 BUY ZONE: Rs. 33-36
📈 TP 1: Rs. 43.10
📈 TP 2: Rs. 48.5
🛑 STOP LOSS: Below Rs. 30 (Daily Close)
📊 RISK-REWARD: High Conviction | 1:2.7+
Caution:
Please close at least 50% position size at TP1 and then follow strict trailing SL to avoid losing incurred profits in case of unforeseen market conditions

INIL LONG TRADEINIL was in downtrend from Jul-Nov 2024.
Since then it is i WYCKOFF Accumulation Zone, having completed AR, PS events and successfully carried out Spring below Major Support and Inducement Level. It has given reversal with validation through required Volume Distribution.
Targets having been calculated from overlying Bearish Order Blocks/ Supply Zones
Steel will be one of sectors to perform exceptionally in pre-budget rally.
🚨 TECHNICAL BUY CALL –INTERNAL INDUSTRIES LTD (PSX: INIL) 🚨
🎯 BUY ZONE: Rs. 140-150
📈 TP 1: Rs. 180
📈 TP 2: Rs. 220
🛑 STOP LOSS: Below Rs. 130 (Daily Close)
📊 RISK-REWARD: High Conviction | 1:3+
Caution:
Please close at least 50% position size at TP1 and then follow strict trailing SL to avoid losing incurred profits in case of unforeseen market conditions

ATRL LONG TRADEATRL was in WYCKOFF Re-Accumulation Zone for six months APR-OCT 2024, giving breakout in OCT 2024 and plotted a high of 770, followed by corrective downward channel. Currently, it has completed all requisite events like TOB (test of breakout), reversal in the form of Inverted Head and Shoulders Pattern. Refinery will be one of sectors to perform exceptionally in pre-budget rally.
🚨 TECHNICAL BUY CALL –ATTOCK REFINERY LTD (PSX: ATRL) 🚨
🎯 BUY ZONE: Rs. 590-610
📈 TP 1: Rs. 680
📈 TP 2: Rs. 750
🛑 STOP LOSS: BELOW Rs 550 (Daily Close)
📊 RISK-REWARD: High Conviction | 1:3+

FFL SHORT TRADEFFL previously completed its uptrend which lasted from JAN 2023 to JAN 2025.
Since then, it is trading in Downtrend channel, it is being rejected by Major Bearish Order Block/ Supply Zone between 16-17.
It seems to have no support before Breaker Block underneath at 11.80
Volume Distribution supports further downfall in the price..
🚨 TECHNICAL SHORT SELL CALL –FFL🚨
🎯 SHORTSELL ZONE : 15.2-16.2
📈 TP 1: Rs. 13.9
📈 TP2 : Rs. 11.7
🛑 STOP LOSS: Above Rs. 17 (Daily Close)
📊 RISK-REWARD: High Conviction | 1:3

ISL Buying StrategyHere's a breakdown of the trading strategy for ISL stock:
Trading Strategy:
- *Breakout Confirmation:* Successful breakout above a certain level (not specified)
- *Buying Strategy:*
- Buy around: Rs. 81-77
- Stop Loss: Rs. 73
- *Targets:*
- 1st Target: Rs. 87
- 2nd Target: Rs. 100
- *Further Action:*
- Hold the stock if it sustains above Rs. 100
- Use trailing stop loss to lock in profits
Key Considerations:
- *Risk Management:* Setting a stop loss at Rs. 73 limits potential losses
- *Profit Booking:* Targets at Rs. 87 and Rs. 100 provide clear profit-booking levels
- *Trailing Stop Loss:* Adjusting the stop loss as the stock price moves up can help lock in profit
