LIVEN PHARMA LONG TRADELiven Pharma was listed in PSX in Dec 2024, and gave a technical spike with 350% gain in just under 30 days, touching sky limit of Rs. 242 price. After a correction expanding to five months, it gave reversal after touching low of 50 on charts, made a HL and is ready to breakout its downward channel. The volume distribution indicates avidity of Smart Money into Liven Pharma script. Accumulation is visible. Smart Money is positioning. Technicals are aligned. This is a high-reward breakout setup.
🚨 TECHNICAL BUY CALL – LIVEN PHARMA (PSX: LIVEN) 🚨
🎯 BUY ZONE: Rs. 60-70
📈 TP 1: Rs. 86
📈 TP 2: Rs. 101
📈 TP 3: Rs. 118
🛑 STOP LOSS: Rs. 62 (Daily Close)
📊 RISK-REWARD: High Conviction | 1:3+

TRG LongTRG has made a perfect bullish harmonic pattern where it has retraced to exact 127.2% of its last top and now will move till 161.8% of its all-time high which is nearly 295. This is not a buy/sell call, its just my own analysis and you may disagree. However, I'd urge you to study bullish and bearish harmonic patterns which are not so common in Pakistani market but some international players often run a stock through this pattern. Similar patterns can be noticed in GHNI and GAL as well.

Play on levels.Now Important Resistance is around
22 - 22.40
Bullish divergence is there but also
near resistance. One may wait for the
resistance level to cross for Fresh Entry.
On the flip side, Godd Support level is
around 19.50 - 20.80

Play on Levels!
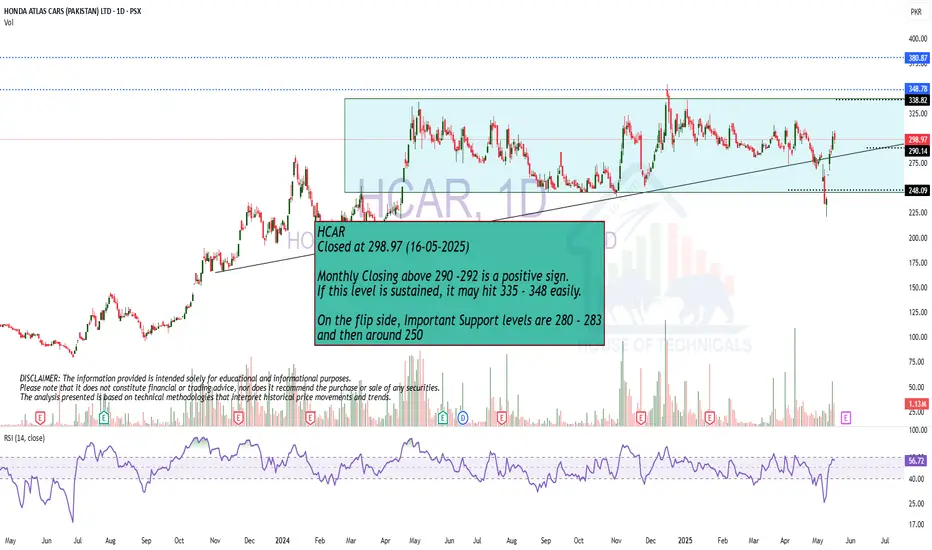
Monthly Closing above 290 -292 is a positive sign.
If this level is sustained, it may hit 335 - 348 easily.
On the flip side, Important Support levels are 280 - 283
and then around 250
Bullish Divergence
Bullish Divergence is appearing on bigger tf.
Crossing & Sustaining 9 may lead it towards
14 - 15.

Wait for the Resistance to Cross!hidden Bullish divergence.
but there is a bearish div. so wait for the resistance to break first.

Beautiful candle but Bearish Divergence is also there..
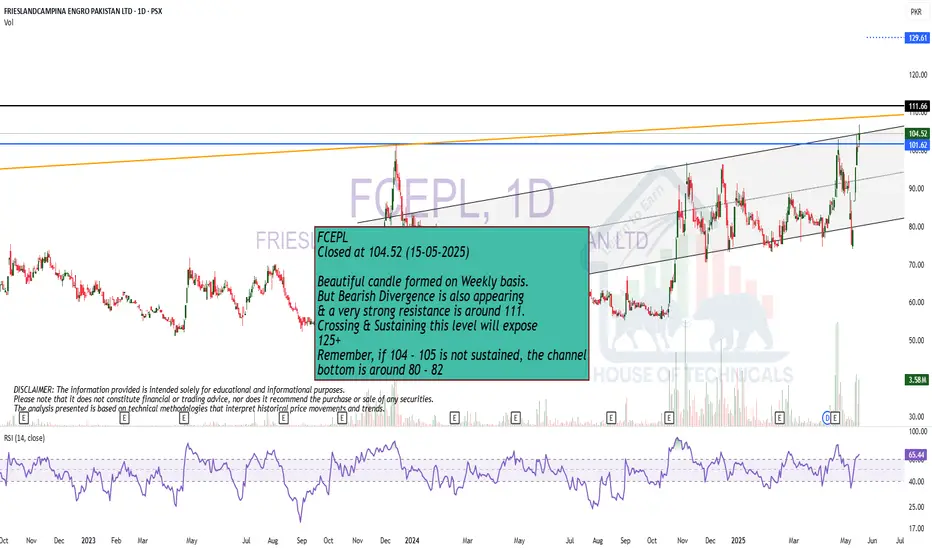
Beautiful candle formed on Weekly basis.
But Bearish Divergence is also appearing
& a very strong resistance is around 111.
Crossing & Sustaining this level will expose
125+
Remember, if 104 - 105 is not sustained, the channel
bottom is around 80 - 82
TOWL LONG TRADE/INVESTMENT SET-UPTOWL has been taking support from a major trend line since 2017.
It has again re-traced back to this support line.
It is expected to bounce to Axis Line, Nearby SZ and recent Swing High in coming weeks.
This set-up is only for people who believe in Investment Mindset to reap Big Gains not quick small gains.
BUY/ ACCUMULATE TOWL 100-120
TP1 150
TP2 200
TP3 230
SL BELOW 80

CSAP LONG TRADE RE-ENTRYCSAP has been going through WYCKOFF RE-ACCUMULATION PHASE from Oct 2024 to Apr 2025.
It gave Valid BO confirmed with Big Weis Wave Volumes, it has re-tested the BO with less than 50% Wave Vol.
It recently posted a HL after re-testing of BO.
This HL will serve as Bench Mark for our SL.
Measured Move Target coincides with SZ, immediate target has been selected as test of recent Swing High
BUY CSAP 118-122
TP1 140
TP2 160
SL BELOW 108

FCEPL LONG TRADE- RE-ENTRYFCEPL has been going through WYCKOFF RE-ACCUMULATION PHASE since Nov 2024.
It has broken out this phase with heavy Weis Wave Volumes and has pulled back with lighter volumes.
Though Measured Move shows Targets beyond 130, but remaining on conservative side we'll keep target just below next 1H SZ at 122.
SL should be below higher low of PB
BUY FCEPL 103-107
TP 122
SL BELOW 97

Bullish Divergence in EFERTThere is a bullish divergence observed in the EFERT chart on the daily timeframe. The current downtrend has already reversed and will be confirmed if the previous LH is broken and a new HL is formed. If the previous LH is broken, it will be a good time to take a long position as indicated on the chart.

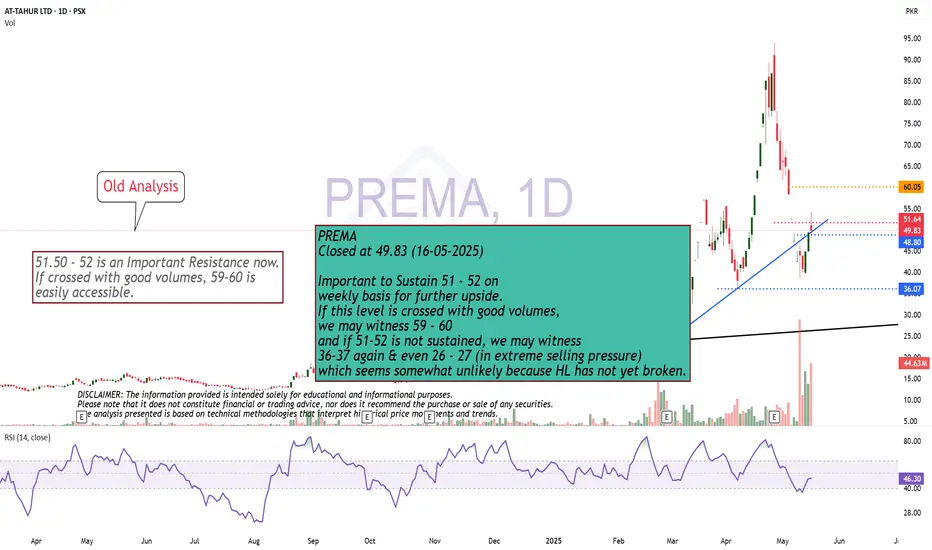
Higher Low intact.Important to Sustain 51 - 52 on
weekly basis for further upside.
If this level is crossed with good volumes,
we may witness 59 - 60
and if 51-52 is not sustained, we may witness
36-37 again & even 26 - 27 (in extreme selling pressure)
which seems somewhat unlikely because HL has not yet broken.
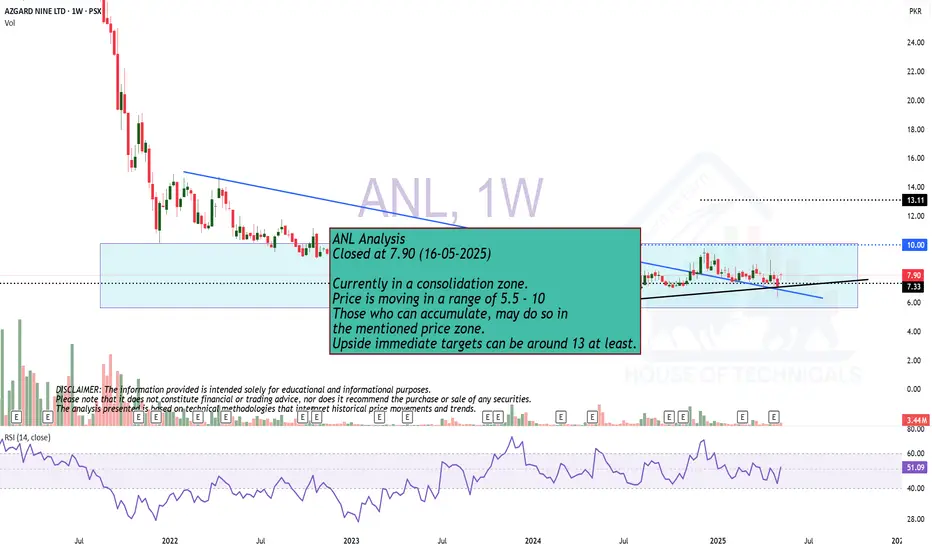
Currently in a consolidation zone.Currently in a consolidation zone.
Price is moving in a range of 5.5 - 10
Those who can accumulate, may do so in
the mentioned price zone.
Upside immediate targets can be around 13 at least.
Inverse H & S pattern appearing..Currently at Resistance around 24.50
Inverse H & S pattern.
Sustaining this level may reach towards 25.50 & 26.70
It should not break 18.50; otherwise we may see trend
reversal.

PAEL SHORT TRADEPAEL previously completed its uptrend which lasted from Sep 2023 to March 2025.
It is its Distribution Phase as per Wyckoff Methodology.
Distribution phase denotes shifting of possession from Strong Hands (Institutions) to Weak Hands (Individuals)
Distribution results in Downtrend.
PAEL seems on the cusp of major DownTrend, at least to the nearest Breaker Block underneath
SHORTSELL PAEL 45-48
TP 35.50
SL 51

HUMNL SHORT TRADEHUMNL was previously trading in Uptrend channel.
Recently it broke down from this channel and has created a Bearish Breaker Block in this process.
It is time and again being rejected from this Breaker Block
With now support underneath in the vicinity of current price, HUMNL is expected to Support/Demand Zone at 9.50
SHORT SELL HUMNL 12.50-13.0
TP 9.50
SL 14.0

CHCC SHORT TRADECHCC has been trading in Downtrend perfect channel since Dec 2024.
Selling volumes on down waves have been on higher side than up waves.
It has once again been rejected by Supply Zone at the top of the Channel.
This whole scenario makes CHCC High Probability Short Trade
SHORT CHCC 270-280
TP 230
SL 300

Bullish Divergence appeared on bigger tf.Bullish Divergence appeared on bigger tf.
Sustaining 33 on monthly basis would be
a positive sign.
36 is the Breakout level.
Immediate targes can be around 43 - 45
If 32 is not sustained on Monthly basis,
we may see further selling pressure towards
25 - 27

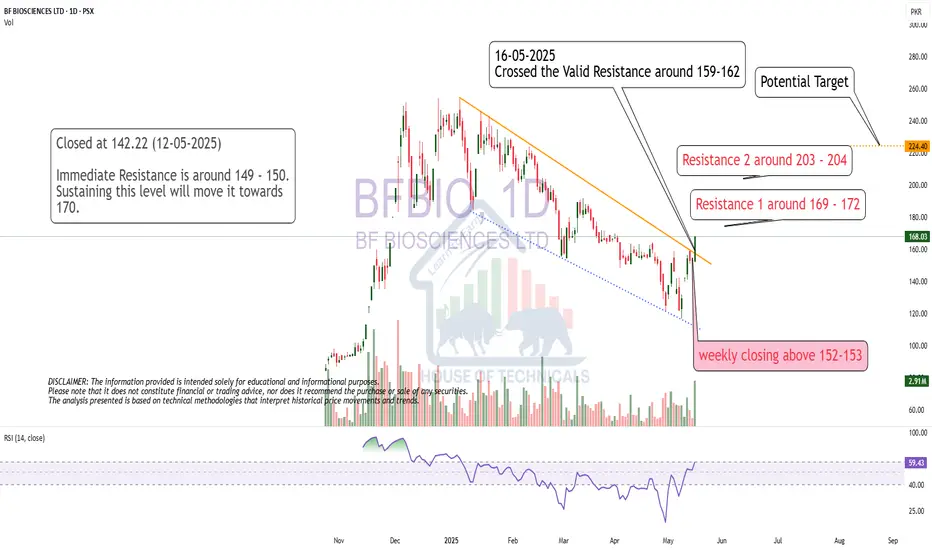
Breakout
Crossed the Valid Resistance around 159-162
Potential target is 220+
However mid resistances are there also.
GCIL LONG TRADEGCIL has been moving in Uptrend channel.
In previous days it has given a low volume SPRING/ BEARTRAP which actually an indication of upcoming Bull Move, which it confirmed today. Accumulate GCIL at current price and every dip to ride on the new up move
Buy GCIL 15.40-17.40
TP1 20.10
TP2 24.10
SL 14.10

FCEPL LONG TRADEFCEPL is in re-accumulation phase of Wyckoff method with HL, HH and Spring happened successfully recently, it is expected to test and breakout of re-accumulation phase
BUY FCEPL 78-82
TP1 88
TP2 98
SL 72

NBP LONG TRADE NBP completed its re-accumulation phase between 73 and 83 and then broke out. It has given a healthy pullback with lower volumes and is now ready to take off to test and even exceed recent highs
Buy NBP 76-80
TP1 83.2
TP2 86.4
TP3 91
SL 72.2

PSO SHORT TRADEPSO's rally today was just a pullback in its continued downtrend.
Its sharp decline in previous days have caused bearish breaker block around 340 level
SHORT PSO 338-342
TP 296
SL 351
