SAZEW | Bullish Flag PatternBack with SAZEW trading idea once again!!!
SAZEW printed a bullish flag pattern with no sign of divergence. A bullish trend continuation is expected, entry is suggested at 1,070 with the stop loss below previous lower high level at 780. Previous top of 1,202 considered as TP1 and after the break out it can leads towards the completion of the pattern, the price can projected towards 1,500 and then 1,700.

KAPCOTrend is Bulish price retracment at 0.618% Buying entry.
Entry price 31
Stop Loss 25
Target price 43

BBFL BUYING OPPORTUNITYBBFL is in Phase C of Wyckoff Accumulation Range
It is making Higher Lows and Higher Highs on 1H TF
It's expected to breakout of this accumulation zone soon
Buy1 51
Buy2 49
TP1 57
TP2 66
SL 47

GCIL LONG TRADEGCIL has started its new leg of uptrend with big volumes
its low risk high probability BUY SETUP

KOSM QUICK TRADEKOSM has reversed its downtrend with big volumes and has successfully re-tested the reversal.
It's considered safe quick profitable trade

SNGP | GRAVESTONE DOJIThe daily chart of SNGP shows a strong bullish trend that recently pushed the stock to new highs, but a potential reversal signal has emerged. A Gravestone Doji has formed near the top, a bearish candlestick pattern that suggests buyer exhaustion and possible trend reversal. This is particularly significant as it occurs after a strong upward rally and near a resistance level. Volume remains notable, signaling high market activity around this level. If the price begins to decline, the key support zone between 115.50 and 118 could act as a cushion for a potential bounce. A break below the support zone may confirm a corrective move.

Important Fib. Support???11.50 - 13.84 is an Important Support Zone.
Wait for the Couple of Bullish Candles in this
Zone for Fresh Entry.

ENGROH-Long term Buying CallAt present, ENGROH is in bearish trend after making head and Shoulder pattern, and making LL and LH. At the moment, it is taking support at 78.6% Fib level. if it breaks this level, then possible support level will be around 135 which is also projection of Head & Shoulder pattern. For long term buying, suggested level ranges between 135-125.


csap-moderate targetEXtended target after breaking rectangle according to 2 hours time frame you can hold it with stop loss 130

Breakout is expected with easy targets
BFBIO has bullish diversion on daily time frame and it start gaining volumes as well, that indicate a breakout. Entry can be taken between 155 to 165 with stop loss of 147, it may hit easy targets of 183 and 201.
Entry : 165
Stop Loss : 147
TP1 : 183
TP2 : 201


TELE LONG TRADETELE is rebounding from the bottom of long term channel after making a Spring below major support.
It is at perfect and least risky level of buy.
BUY1 7.5
BUY2 7.1
TP1 8.2
TP2 8.8
LONGTERM TP 10.7
SL 6.6

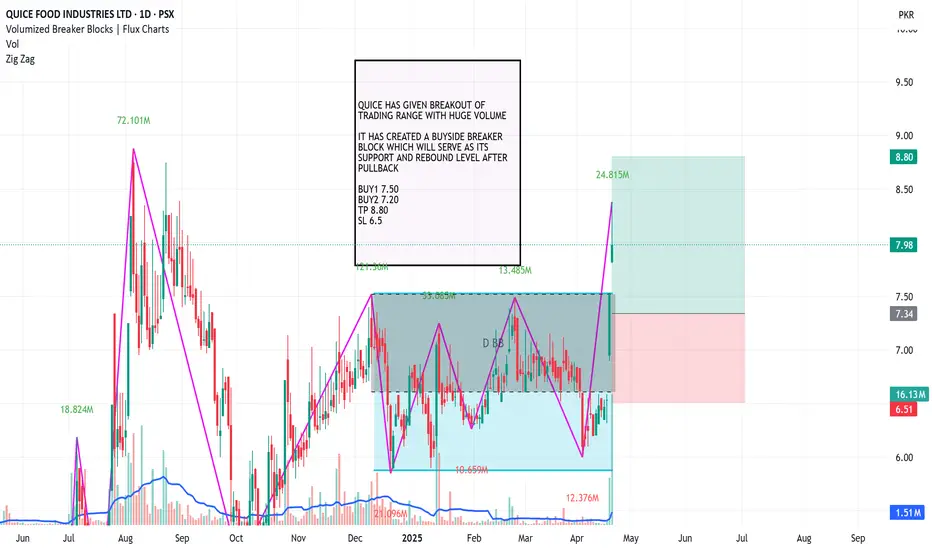
QUICE BUY TRADEQUICE has broken out from its recent trading range with big volumes
It has created buyside Breaker Block which will act as its major support and rebound level after its pullback
BFBIO- LEAST RISK HIGH PROBABILITY LONG TRADEBFBIO successfully completed its correction and broken its downward resistance line.
Very low risk trade.

GLAXO-SHORTAfter double top now it will take correction so take exit in time and buy at target when it reached.

UNITY | Parallel Channel On Weekly Time FrameThe price is moving in a parallel on the daily timeframe, indicating a potential massive bullish rally. Showed a pull back from 200-day EMA and currently 4% up. We anticipate a 45% bullish wave in the coming days.
Trading Strategy
- Entry: Consider long positions at 27.50
- Stop-loss: Set at 23.93, just below the support level
- Risk-reward ratio: 1:3.5
- Swing Trade Target Level: 40
Trading Reminder
- Assess your risk and calculate potential losses before entering any trade.
- Trade wisely and only enter positions that align with your strategy and risk tolerance.
- Stay calm and avoid impulsive decisions driven by FOMO. Trading is a long-term journey.

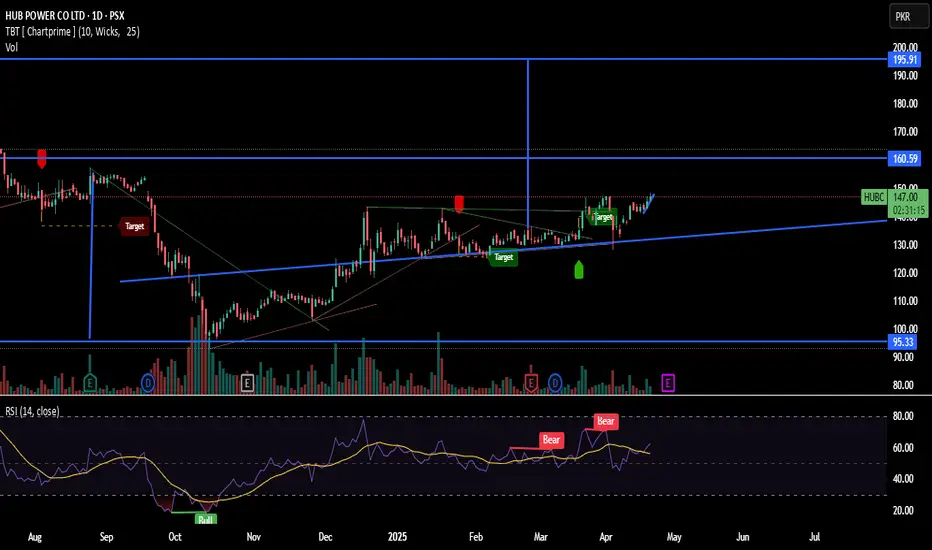
HUB POWER CO LTD (PSX: HUBC LONG IDEATargets:
160.59 PKR — This is the first key resistance level and a clear target, where the price might face selling pressure.
195.91 PKR — Major upper target or longer-term resistance zone, if the momentum continues.
💪 Supports:
95.33 PKR — Strong historical support, price has bounced from this level before.
Around 135-138 PKR — This area, marked by the blue trendline, is acting as dynamic support as the price respects the upward trend.
📊 RSI Insight:
RSI is at 62.38, which is heading toward the overbought zone but still has room for upside.
Watch for an RSI break above 70 for overbought or below 50 for potential weakness.
The chart shows a bullish breakout above minor resistance, approaching 147 PKR now. If it sustains above this, 160.59 looks like the next pit stop.
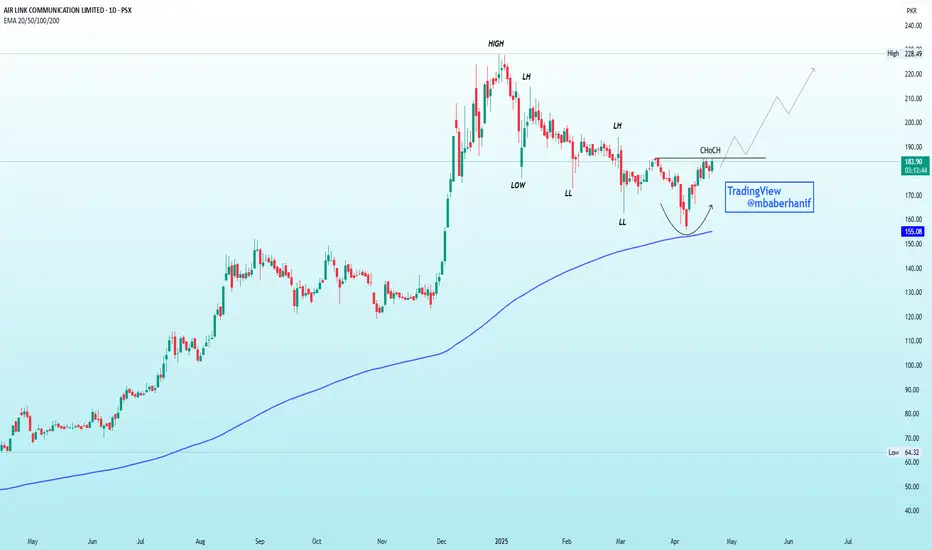
AIRLINK | An Imminent Reversal!!!Previous Trend: Bearish, confirmed by Lower Highs (LH) and Lower Lows (LL).
CHoCH (Change of Character): Bullish signal—price broke previous LH.
Pattern: Rounded bottom forming near the 200 EMA (~155), acting as strong support.
Volume: Slight pickup near bottom—early sign of accumulation.
Outlook: Bullish reversal likely. Break above CHoCH with volume confirms uptrend.
ATLH - Breakout ATLH breakout of long resistance trendline. Buy now or at retest to target 1300-1400 area (TPS marked)

Let the Resistance Cross & Sustain!Bullish Divergence on Weekly as well as Monthly TF.
Hidden Bullish Divergence on Daily TF.
Immediate Resistance is around 8.20 - 8.30
Important Resistance Zone 9.80 - 10.90
Crossing & Sustaining will expose 13 - 13.50 initially.

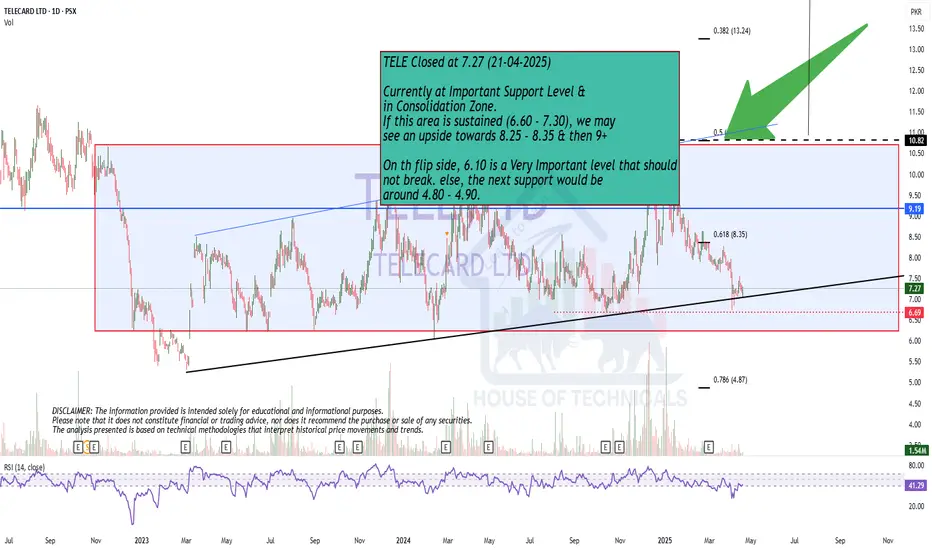
Currently at Important Support Level..
Currently at Important Support Level &
in Consolidation Zone.
If this area is sustained (6.60 - 7.30), we may
see an upside towards 8.25 - 8.35 & then 9+
On th flip side, 6.10 is a Very Important level that should
not break. else, the next support would be
around 4.80 - 4.90.
FFC : Bullish Divergence Trading Setup (Hourly Time Frame)A Bullish Divergence has been identified between Price and Momentum indicators on the Hourly chart, signaling a potential Bullish Reversal. This divergence suggests weakening downside momentum and increasing probability of an upward move.
Entry levels and Target Prices (TPs) are clearly marked on the chart.
Traders are advised to consider the Stop Loss (SL) at the level indicated on the chart to manage risk effectively.
This setup favors bullish positioning with calculated risk-reward parameters. Monitor price action around the entry zone for confirmation before execution.
