FCCL- LONG TRADEFCCL is moving in Uptrend Channel. it recently broke a support but which proved to be a bear trap or spring. Currently it's on Spring board or retest lvl.
Buying 45-47
TP1 49
TP 2 51
TP3 53
SL below 44

SEARL- SHORT TRADESEARLE is in downtrend channel, its bearish attitude is also confirmed with Volume Behavior Analysis.

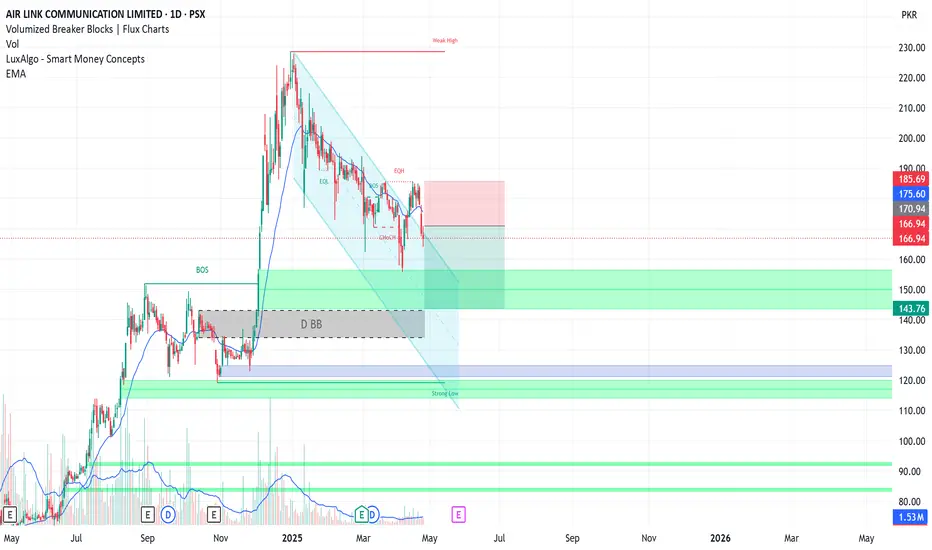
SHORT SELL AIRLINKAIRLINK is in Downtrend since January 2025.
It has recently tried to Breakout of the downward channel but failed to post a higher high
It has created a double top instead
Short Airlink 166-177
TP1 156
TP2 143
SL 186
BOP SHORT TRADEBOP has recently broken its upward trendline with heavy volumes
Short sell BOP 9.7-10.7
TP1 8.8
TP2 7.8
SL 11.1

CNERGY SHORT TRADECNERGY has recently broken down of its upward trend line after encountering Bearish Breaker Block
It is expected to continue its new downtrend
Short CNERGY 7.8-8.1
TP 6.8
SL 8.9

PSO SHORT TRADEPSO failed to post a Higher High in its effort in March 2025
It has broken down its Upward Trendline with heavy volumes
It is expected to continue downward at least till its next support at 325
Short Sell PSO 370-360
TP 325
SL 381

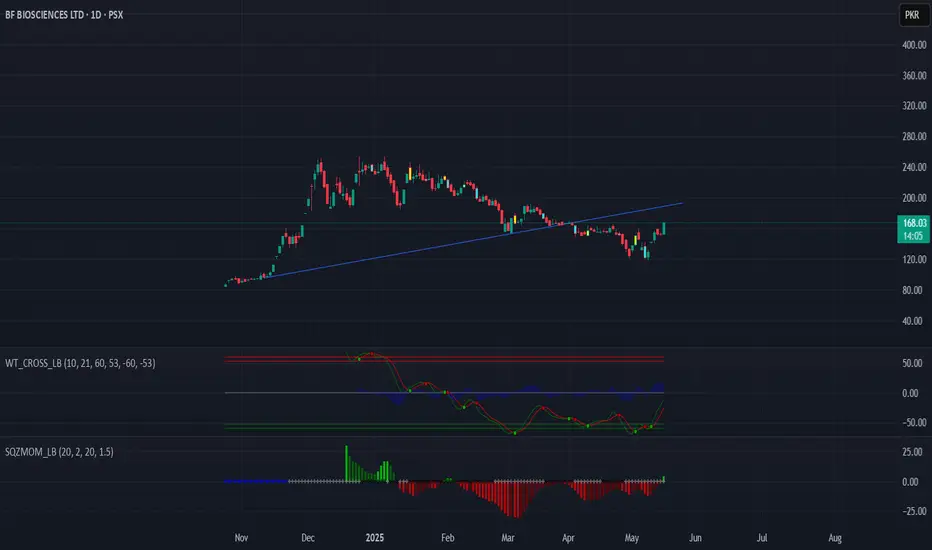
BF BIOSCIENCE BullishBUY SIGNAL...!!!!
Recent Price Movement: As of May 16, 2025, BFBIO's stock price closed at PKR 168.03, marking a 10% increase for the day. Over the past week, the stock has risen by 11.86%, although it has experienced a 3.45% decline over the past month.
TradingView
Technical Analysis: The stock is currently in a bullish zone, with analysts suggesting potential movement towards the PKR 200–250range in the near future. WT Cross indicators shows a great breakout from -55 zone which shows a strong trend reversal where as squeeze momentum breakout green histogram
Moving Averages: The 5-day and 50-day moving averages are at PKR 153.76 and PKR 143.35 respectively, both indicating a bullish trend.
Investing.com
Relative Strength Index (RSI): The 14-day RSI stands at 62.67, suggesting that the stock is approaching overbought territory, which often precedes continued upward momentum
a Very Strong Weekly Bullish Candle; but
a Very Strong Weekly Bullish Candle; but
there is a Resistance around 240 - 245.
Crossing this level may hit 290+
On the flip side,
though Channel Support s around 165 - 170 but
we also have a Strong Support around 190.

Though Bullish but..
Though Bullish but Bearish Divergence has appeared
on bigger TF.
ABCD Pattern intac but only if 155 is Crossed & Sustained
with Good Volumes.
Upside Targets can be 200+
Good Support levels are 136 - 138 and then around 123 - 125

LOTCHEM PROBABLY IN WAVE ' X ' OR ' Y ' OF A CORRECTIONAs per our preferred wave count LOTCHEM is in wave Y which should take prices further down toward the 13 level and if bearish trend stays strong then even 9.50 is on the cards, however prices need to break below 15.53 level first.
Alternately prices can still be in X wave and will take prices further up towards 25.40 - 27.40 range and if the bullish trend stays strong 31 level is also at hand, however prices will have to break above 20.20 level first.
As the overall momentum of the PSX is bearish and our preferred wave count is bearish, We will activate short sell trade once price close below the red trendline on the daily chart.
Incase prices never close below the red trendline and starts rising, We will enter long position at 20.20 targeting 25.40 range. I will share stop loss for the trade setup once our trade gets actived
Let see how this plays, Good Luck!
Disclaimer: The information presented in this wave analysis is intended solely for educational and informational purposes. It does not constitute financial or trading advice, nor should it be interpreted as a recommendation to buy or sell any securities.

OGDC LONG TRADE/INVESTMENT FOR 50% GAINOGDC has been consolidating in a Scallop formation or a variant of Cup and Handle from Jun 2017 to Nov 2024.
It broke out of this formation in Nov 2024, The authenticity of Breakout is very much evident from heaviest Weis Wave Volumes.
OGDC has successfully re-tested the breakout in initial week of this month.
The re-test has been on ideally low volume, which has been marked on Weis Wave Volume.
The Measured Move Projections show high potential for gains in coming weeks
BUY/ ACCUMULATE OGDC 200-220
TP1 235
TP2 278
TP3 312
SL BELOW 190

KING EFERT IS BACK- LONG TRADE WITH PRICE AND TIME TARGETSEFERT is going through Elliot Wave Cycle on 1W TF.
It has completed Impulse Waves 1 & 3 with corresponding corrective Waves 2 & 4 (with Wave 4 being complex corrective wave).
It has started it Wave 5 ( FINAL IMPULSE WAVE ) this week.
We have applied Fib Projections with Time Cycle Projections to ascertain Most Likely Price Targets with probable time to achieve the targets.
BUY/ ACCUMULATE EFERT 170-190
TP1 225
TP2 250
TP3 275
LONGTERM TP 312 ( TIME PROJECTION OCT 2025 IN SHA ALLAH )
SL BELOW 160

PIBTL LONG TRADEPIBTL is trading in uptrend HTF ( Higher Timeframe ) Blue Channel
It has been retracing since last one month or so.
It has gone through Selling Climax and has given reversal and Breakout from Bearish Channel which is in fact Bull Flag.
Weis Wave Volumes confirm validity of the reversal/breakout\
BUY PIBTL 8.60-8.30
TP 10.60
SL 7.90

ISL HIGH PROBABILITY LONG TRADE- BUY BEFORE EVRYONE ELSEISL has completed its retracement, which it started in Jan 2025 from 106.
This retracement is in shape of Bear Channel which acts as Bull Flag on Breakout.
This Bear Channel has completed three pushes and Selling Climax which are harbingers of imminent which is confirmed buy new up leg which it has started after taking support from powerful Breaker on 1D.
All factors point to Uptrend in coming few days.
BUY ISL 70-75
TP1 88
TP2 101
TP3 110
SL BELOW 62

TPLP LONG TRADE TPLP was in Downtrend since Jan 2025.
It's in Bear Channel which acts as Bull Flag as per Price Action Techniques of Al Brooks.
After going through Selling Climax which is necessary before reversal TPLP has taken support from Bullish Breaker Block at 6.30.
Weis Wave Volumes suggest that its rise from this bottom will lead to Breakout from this Bull Flag.
Buying is recommended when it pulls back to FVG at 8.20
BUY TPLP 8.20-8.00
TP 10.60
SL BELOW 7.00

ENGROH LONG TRADEENGRO is in Uptrend since Feb 2023, its last spike resulted in climactic rise from Oct 2024 to Dec 2024, since then it's retracing in channel which was completed around 140 Level.
It has given breakout of this downward channel yesterday with heavy Wave Volumes and is poised to start new leg of its uptrend
BUY ENGROH 164-174
TP1 192
TP2 218
SL BELOW 155

HTL LONG TRADEHTL has been in uptrend since Feb 2024, it has been pulling back since Dec same year.
It has recently established Spring at major support level of 32.
Spring can also be called Liquidity Sweep/BearTrap/ShakeOut/False Breakout.
As explained several times, that the phenomenon is a precursor to uptrend.
Though HTL seems primed for much awaited Breakout which will be at 41, buying before that level is not recommended at all.
BUY HTL ONLY IF BREAKS ABOVE 41
TP1 46.6
TP2 51.6
TP3 58.1
SL BELOW 36

PSX LONG TRADEPSX has been trading in Wyckoff Accumulatio Zone since last month
It has completed following phases of the accumulation zone which are necessary for new uptrend
SC---Selling Climax
AR--- Automatic Rally
PS---Primary Support
ST--- Secondary Test
Terminal Shakeout
BUY PSX 26.4-27.4
TP1 30.2
TP2 32.6
TP3 36.3
SL BELOW 25

HH HL still intact.
HH HL still intact.
Hidden Bullish Divergence has appeared.
We may expect the reversal only if 36 is not broken.
49-50 can be immediate targets in case of reversal.

Bullish Divergence on DTF.
Bullish Divergence on DTF.
Important Resistance is around 52.50
However, sustaining this level will
expose 55 - 60 zone.

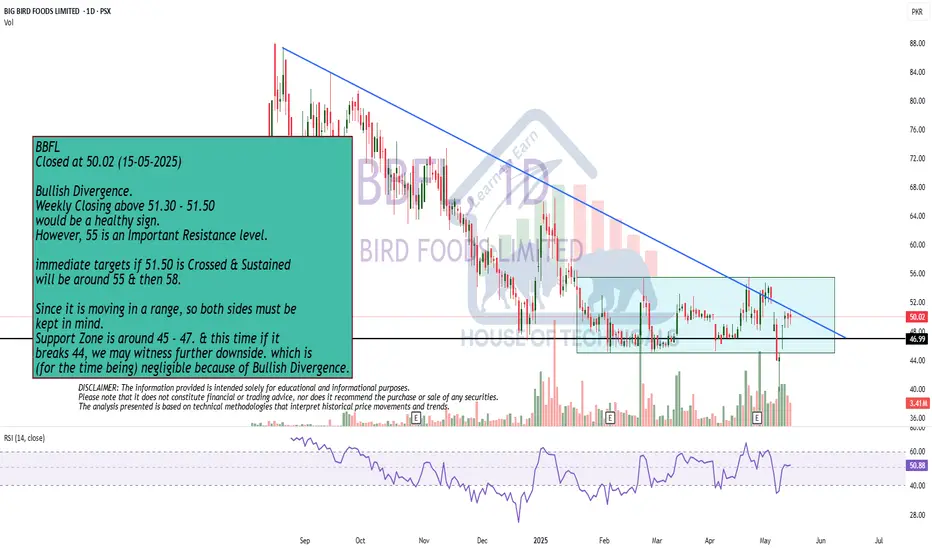
Bullish Divergence.
Bullish Divergence.
Weekly Closing above 51.30 - 51.50
would be a healthy sign.
However, 55 is an Important Resistance level.
immediate targets if 51.50 is Crossed & Sustained
will be around 55 & then 58.
Since it is moving in a range, so both sides must be
kept in mind.
Support Zone is around 45 - 47. & this time if it
breaks 44, we may witness further downside. which is
(for the time being) negligible because of Bullish Divergence.
HCAR LONG TRADEHCAR has been in Bearish Channel which actually acts as Bull Flag.
It went below the channel in false breakdown to facilitate Selling Climax which is transfer of possession from Weak Hands ( Individuals ) to Strong Hands ( Institutions ).
This process and its components are actually a fuel for future uptrend.
Low Wave volume during Selling Climax/ Bear Trap are signs of Fake Breakdown to influence weak hands to sell their shares so that institutions have ownership during uptrend
BUY HCAR 290-300
TP1 320
TP2 340
SL BELOW 280

Monthly Closing above 7.50 - 7.60 will be very healthy!
Monthly Closing above 7.50 - 7.60
would be a very healthy sign.
We may then easily witness upside
towards 8.70 - 9.10 & then 10.50 - 11
Remember it is in a long consolidation
with Slowly moving in an Upward Channel.
