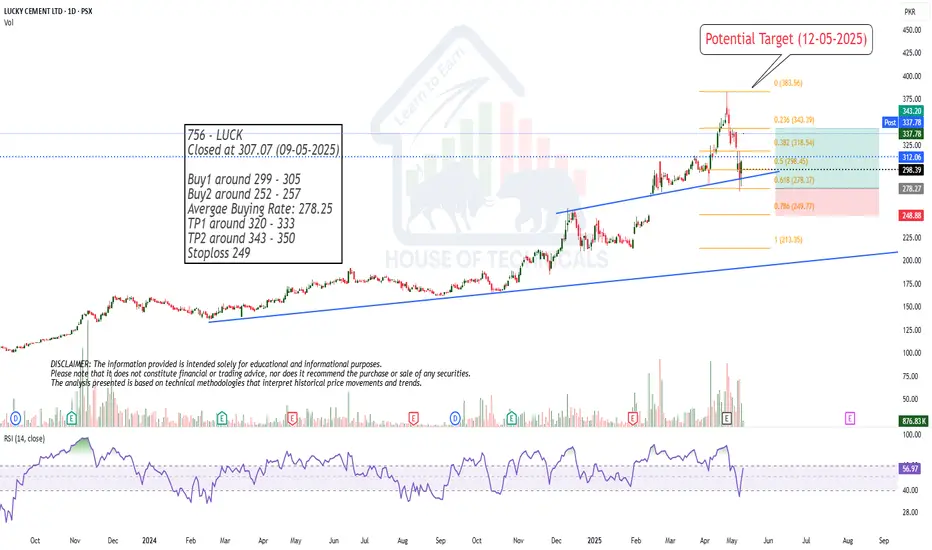
Bullish Flag Pattern.
Bullish Flag Pattern.
Crossing 435 with Heavy volumes will
trigger more positivity & will expose
New Highs targeting 700+
On flip side, breaking 300 now, will
bring more selling pressure.

CNERGY SHORT TRADECNERGY has been previously moving in a subdued and weak uptrend, recently it broke below its uptrend line and also crossed underneath 20 EMA. Both of which are indicative of its new downtrend.
Weis Wave Volumes support this bearish scenario with volumes on down leg multiple time more than recent up leg
SHORT CNERGY 7.30-7.50
TP 5.40
SL 8.50

MARI LONG TRADEMARI has been consolidating in accumulation zone as per Wyckoff methodology, this area can also be seen as Double Bottom Bull Flag as per Al Brooks Price Action Method.
Above scenario supports a rise in Mari to test and exceed previous highs.
BUY MARI 630-650
TP1 720
TP2 900
SL 590

GHNI LONG TRADEGHNI has been trending upwards in a channel.
It recently broke below the support/axis line but quickly moved above it creating an spring/beartrap, which is a precursor of sharp upward move.
BUY GHNI 680-700
TP1 755
TP2 840
SL 640

PAKRI LONG TRADEPAKRI broke out of its 07 years trading range in March 2025.
It is now trending in uptrend with a clear trendline.
In recent days it took support from this trendline and started new arm of its uptrend
Buy PAKRI 11-12
TP 14.0
SL 10.10

2nd Consecutive Cap after my call.
2nd Consecutive Cap after my call.
Now 162 - 163 is the Resistance.
Crossing it will lead it towards 170 & then 189-190

MARI Petroleum Company Ltd (PSX) Buy Idea✅ Buy Idea Summary
Symbol: MARI
Timeframe: Daily
Current Price: 652.96
📊 Analysis & Plan
Context:
Price has bounced from a higher-timeframe demand zone (highlighted in blue) and is currently forming a bullish structure.
Key Observations:
Swing Failure Pattern near top (distribution clue).
Liquidity Pool marked at 720 — likely target for short-term buy-side liquidity.
Strong bullish reaction after price tapped near the low of the previous range.
🛒 Entry:
At/around: 652.96 (Post price).
🎯 Target Levels:
TP1 (Partial/Intraday): 720 (Liquidity Zone)
TP2 (Major Target): 829.88
TP Final: 900.23
🛑 Stop Loss:
Below 539.13 (last swing low and structural invalidation)
📥 Reinforcement Buy Zone:
Blue Demand Area (around 460–500):
“If I got here, I will look to buy more.”
→ A key reaccumulation area if price revisits.

No Payout but..
Though NO PAYOUT, but Very Good Result.
If 31.50 is Sustained, we may witness 34-35
tomorrow.

Buy Idea: FAUJI FERTILIZER CO LTD (PSX)🔷 Buy Idea: FAUJI FERTILIZER CO LTD (PSX)
Context:
Price tapped into a discount zone, swept liquidity below the recent lows, and formed a strong bullish engulfing candle. The setup aligns with a low resistance liquidity run toward the higher timeframe distribution zone.
✅ Entry Criteria:
Entry: Above the bullish candle close at ~366
Stop Loss: Below the recent swing low at ~323
Target: Monthly resistance / low resistance area at ~435
RR Ratio: ~1:2.5+
📊 Justification:
Liquidity Sweep: Price swept the previous low (creating inducement)
FVG Reaction: Immediate bullish reaction from the demand/FVG zone
Distribution Zone Targeted: Market is likely to grab liquidity from unfilled sell orders in the upper zone
No major resistance till 435 (clean traffic)
⚠️ Risk Notes:
Confirm daily candle closes above 366 before entry
Monitor any reaction at ~390-400 distribution zone

Buy Idea: ADAMJEE INSURANCE CO LTD (PSX) – Daily TimeframeBuy Idea: ADAMJEE INSURANCE CO LTD (PSX) – Daily Timeframe
Price has recently formed a bullish dealing range (DR) after reacting strongly from the monthly demand zone (M T2). The current structure shows price respecting this DR, indicating potential upside movement.
🔹 Entry: Inside the DR box around 46.00
🔹 Stop Loss: Below DR low (~39.70)
🔹 Target: Monthly TP zone around 64.12
🔹 Risk-to-Reward: >2.5R
Confluence:
Price bounced from a strong monthly demand
DR formed and respected, confirming a potential reversal zone
Clean monthly target area aligned with previous highs
Bias: Bullish
Trade Type: Swing trade
Strategy Basis: Demand reaction + DR formation + HTF alignment

Sazew is near to bearish zoneSazew is near breakdown level of 1297.87 (bearish zone). It is expected to drop to 1168.17. Stop loss is 1355
Note: This is not a buy/sell call, It is an analysis.

Bullish Momentum
Closing above Trendline around 133 - 134
would keep it Bullish.
Upside targets can be around 150-160.
However, breaking 131 will bring more
selling pressure towards 113 - 115.

Still Potential to Move Up.It still has the Potential to Move Further Up.
It was Capped today with Huge Volumes.
Potential Target is around 380+
Still Positive
Immediate Resistance is around 149 - 150.
Sustaining this level will move it towards
170.

Hidden Bullish Divergence
Hidden Bullish Divergence is there.
Still have the potential; and may touch
17 & then around 21.
Trailing SL (at 13) is the Best Strategy for those who
are in this Trade as per our last analysis shared.


LONG INILLonged INIL. Bought spot shares. Broken out of range. Should take a while to play out as I am trading mostly on weekly and monthly charts. Entry, Stop Loss and Exit all there. Worth a punt!
Will update in due time as we go forward.
Manage your risk! #DYOR

AKBL PROBABLY IN WAVE " B " or " C/3 " SHORTAKBL is most probably in wave C or 3 which has started or is still in wave B.
As per our preferred wave count AKBL is in wave C or 3 which has started to unfold and will take the price down towards 26 - 24 range. We are already active in this trade aggressively, however the cautious way to trade this setup is to wait for a break below 33.40.
Alternately, there is a possibility that we are still in wave B which can unfold with sideward movement or a break above 44.99.
This setup will get invalidated once price break above 42.72.
Trade setup:
Entry price: 38.01
Stop loss: 42.72
Targets:
T1: 26 - 25.80 range
T2: 24.30 - 22.90 range
Let see how this plays, Good Luck!
Disclaimer: The information presented in this wave analysis is intended solely for educational and informational purposes. It does not constitute financial or trading advice, nor should it be interpreted as a recommendation to buy or sell any securities.

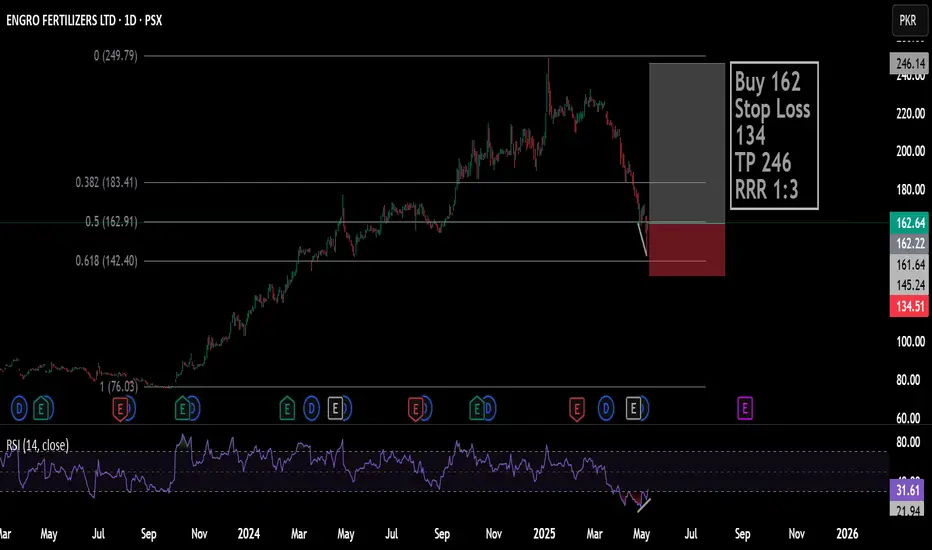
EFERTTrend is Bulish price retrace at fib level 0.618% with Bulish divergence
target price last High
Buy 162
Stop Loss 134
TP 246
RRR 1:3
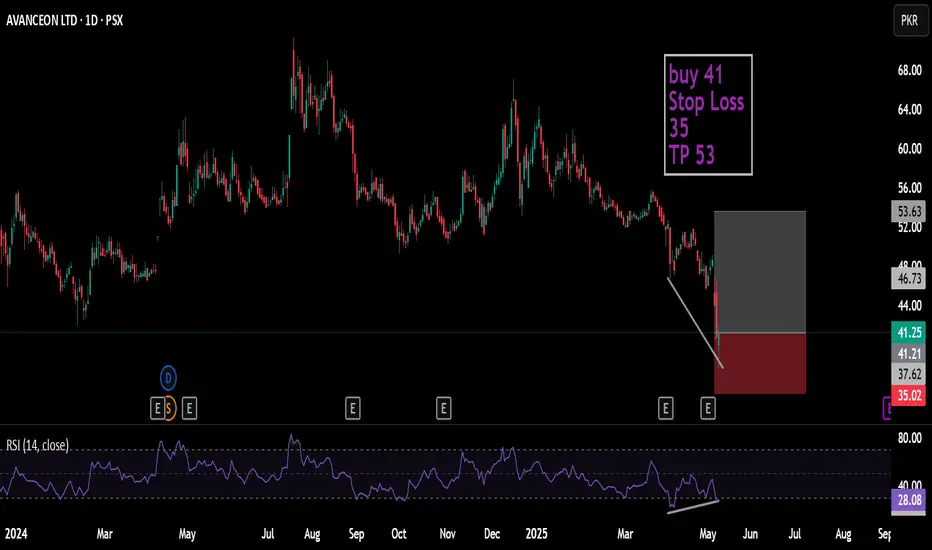
AVNbuy 41
Stop Loss 35
TP 53
Buy at stronge support with Bulish Divergence at RSI also Green candle close.
PPL PROBABLY IN WAVE '' A '' OR " B " - LONGThis is in continuation to our previous published idea in which we decided not to take buy positions due to developing geopolitical tensions which luckily was a wise decision. Now since the tensions have eased up and the bail out have been approved, the bullish scenarios have opened up again.
PPL is most probably in wave C of an A or B wave which is about to get completed. Our preferred wave count suggest that we should get one more leg down towards 124-106 range marking the end of the downtrend.
Alternately, if the prices start to rise and do not go below 128.56 and takes out 155, we will mark this C wave as completed.
Trade setup:
Entry price: 124-106
Stop loss: We are bullish on PPL long term therefore we will hold these positions
Targets: will update later once price reach our buy zone
Let see how this plays, Good Luck!
Disclaimer: The information presented in this wave analysis is intended solely for educational and informational purposes. It does not constitute financial or trading advice, nor should it be interpreted as a recommendation to buy or sell any securities.

TRG LONG TRADETRG was in BULL RUN since March 2020 to April 21, it is trending in bullish channel since 2020, it has now bottomed out in this channel as seen in 1W chart at bottom.
As seen in 1D chart it has given bullish reversal on heavy volumes on upward leg and much lighter volume on downward pullback, furthermore it has successfully created an Spring or Bear Trap which is precursor to up move.
Price Action also suggests an impending uptrend since the pullback is in the form of Bear wedge which is in fact a Bull Flag that has completed its three pushes on downside. It also confirms the take off to upside
BUY TRG 56-60
TP1 69.5
TP2 82.5
SL 51.1
