CSAP LONG TRADECSAP went through re-accumulation phase as per Wyckoff Methodology from 21/04/24 to 21/4/25. It, then broke out of this zone and is now re-resting the Order Block which caused the Break Out.
Buy CSAP 100-110
TP1 139
TP2 159
SL 88

HBL PROBABLY IN WAVE '' C '' OR " X " - SHORTThis is in continuation of our HBL wave count/idea shared earlier.
HBL is most probably in wave C or X which will take price down towards 127-122 range area,
prices are currently at a resistance level which has acted as a strong support previously therefore we are confident that it should hold and keep prices from climbing up.
We will short sell HBL once price break below 146.80 level and will target 133-130 range and further down 124-122 range, however prices might reach 160 before starting its decline. Alternately if prices break above 163 then this trade setup will get invalidated.
Although the risk/reward ratio is not that impressive but looking at the overall stock market momentum and geopolitical unrest, we have a little more confidence in this trade.
Trade setup:
Entry price: 146.80
Stop loss: 163
Targets:
T1: 133-130
T2: 124-122
Let see how this plays, Good Luck!
Disclaimer: The information presented in this wave analysis is intended solely for educational and informational purposes. It does not constitute financial or trading advice, nor should it be interpreted as a recommendation to buy or sell any securities.

Play on Levels
Plan1
Buy around 118 - 121
Sell around 130 - 132
Stoploss 110
Plan2
Buy above 142
Sell around 149-150
Stoploss 136

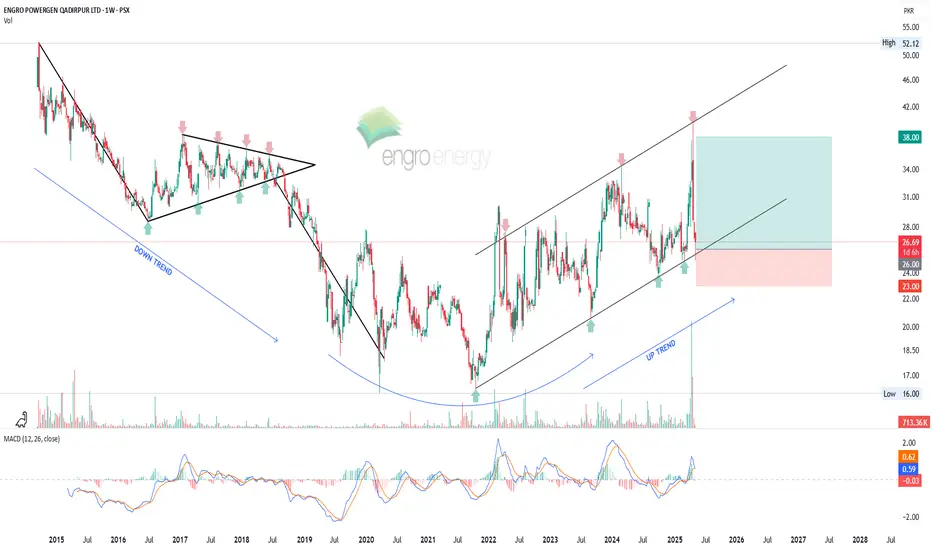
EPQL - Swing Trade SetupThe current price action is testing the support of an ascending parallel channel. A potential pullback from the 26 level, which aligns with the channel's support, is anticipated. If the price rebounds from this level, a swing trade setup could be confirmed, with a possible target of 38.
However, the MACD indicator has recently crossed over to the downside on weekly time frame, with red histograms forming. To confirm a more reliable entry point, we will await a reversal signal from the MACD indicator.
LONG MUGHALLonged MUGHAL. Bought spot shares, no leverage. Resting above weekly support, broken down trend. Entry, Stop Loss and Exit all there. Will take a while to play out. Patience is always rewarded. Worth a punt!
Will update in due time.
Manage your risk! #DYOR

LONG AGHALonged AGHA. Bought spot shares, no leverage. Resting above monthly support. Entry, Stop Loss and Exit all there. Will take a while to play out. Nice reaction in august of that monthly support. Should hold for uptrend to continue. Patience is always rewarded. Worth a punt!
Will update in due time.
Manage your risk! #DYOR

LONG EPCLLonged EPCL. Bought spot shares, no leverage. Resting above monthly support. Entry, Stop Loss and Exit all there. If it claims back above 40, it should be the new support and it should run then imo. Will take a while to play out. Patience is always rewarded. Worth a punt!
Will update in due time.
Manage your risk! #DYOR

NETSOL LONG TRADENETSOL is rebounding from its strong support after liquidity sweep, Weis Wave Volumes show positive shift of volumes to bullish side
BUY NETSOL 124-128
TP 142
SL 119

Hidden Bullish Divergence +Hidden Bullish Divergence +
Closing above 298 is a +ve sign.
Immediate Support can be around 283 - 287.
Breaking 272 may bring more
selling pressure towards 246 - 250.

MARI PROBABLY IN WAVE '' C '' OF CORRECTION - SHORTThis is in continuation to our ongoing tracking of MARI.
MARI is most probably in wave C of an ABC correction and since prices moved down giving confidence to our bearish wave count, we are taking a small position by short selling.
Due to market volatility we will trade this setup with cautious using trailing stop loss until we reach our target. We only recommend small positions at the beginning and once prices starts to unfold in our favor we will add more to our positions on bounce backs
Alternately prices can move up toward 650-660 level which is highly unlikely now but not out of question
If our wave count is correct then we can make around 8.50% or 15.50% on this trade.
Trade setup:
Entry price: 604
Stop loss: 632
Targets:
T1: 535-550
T2: 515-500
Let see how this plays, Good Luck!
Disclaimer: The information presented in this wave analysis is intended solely for educational and informational purposes. It does not constitute financial or trading advice, nor should it be interpreted as a recommendation to buy or sell any securities.

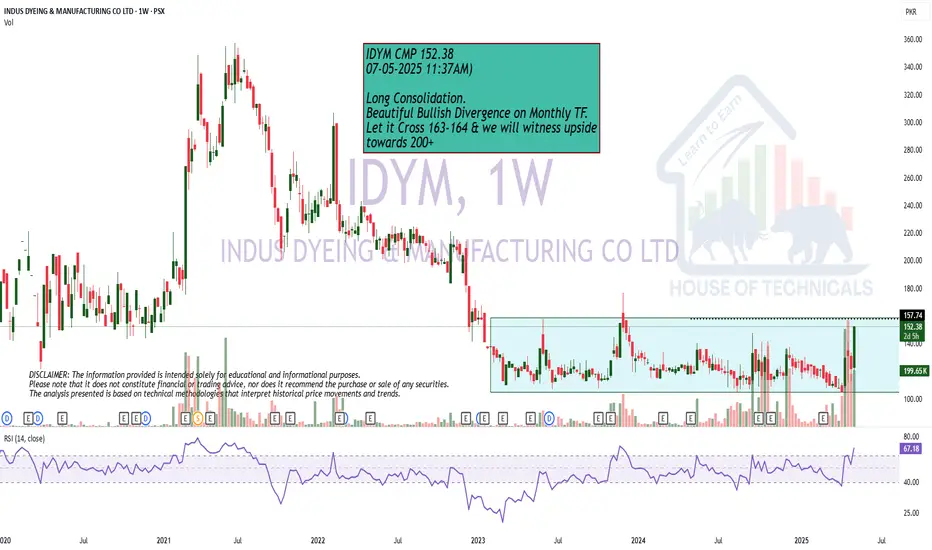
Near BreakoutLong Consolidation.
Beautiful Bullish Divergence on Monthly TF.
Let it Cross 163-164 & we will witness upside
towards 200+
at an Important Support
25.40 - 26 is an Important Support level.
25 should be the SL.
Upside targets can be around 27 - 28 initially.

PPL PROBABLY IN WAVE '' A '' OR " B " - LONGPPL is most probably in wave C of an A or B wave which is almost completed or about to get completed. our preferred wave count suggest that we should get one more leg down towards 144-140 range which will touch the long term yellow trendline and prices should bounce from there, the other possibility is that price will not go below 147 and will keep on climbing toward 173-183 range or towards the blue trendline.
Alternate wave count suggest that wave C might get extended and will keep on declining reaching our long term buy zone of 124 - 106 range.
So this is how we will trade this setup:
Scenario 1:
If 147 is not taken out and prices keep on rising then we will not take any trade because our confirmation level is 164.11 and target is 173-183 which does not give us a good risk/reward ratio
Scenario 2:
If prices do decline below 147 and reach 144-140 level, we will buy a small portion at that level and will wait for a bounce from the yellow trendline, if prices unfolds as predicted then we will add more to our long positions using swing trade. However, if prices keep on declining towards our long term buy zone then we will add positions at 120-110 levels. PPL has strong fundamentals therefore we are quite comfortable holding it for long term.
Trade setup:
Entry price: 144-140
Stop loss: We are bullish on PPL long term therefore we will hold these positions
Targets: 173-183 (Ideal is upper blue trendline)
If our wave count is correct then we might make 20.97% or 25.87% of gross profit on this trade
Let see how this plays, Good Luck!
Disclaimer: The information presented in this wave analysis is intended solely for educational and informational purposes. It does not constitute financial or trading advice, nor should it be interpreted as a recommendation to buy or sell any securities.

PSO PROBABLY IN WAVE '5' or '4' - LONGPSO is most probably in wave 5 of 3rd wave which can be an ending diagonal or impulse wave.
As the 3rd wave was a big extended wave, 5th wave should not extend and will not make a significant move up.
Volume divergence should also appear between 3rd and 5th wave, further breakup of wave 5 of 3rd: if the count is correct then wave 1 is completed and prices will retrace back to trendline marking wave 2 and only then move forward up.
Alternate count is that we are still in 4th wave, as 4th waves can be any corrective pattern it is not wise to mark them as completed until we see further confirmations. In 4th wave we are in wave B which also can be any corrective pattern.
Our preferred wave count is 5th wave up which will provide a buy opportunity once price retrace back.
Note: We are not trading this move because we already have MARI and POL moves at our hand which are showing more promising returns and have better fundamentals then PSO at the moment.
Feel free to comment and share your thoughts if you like.
Let see how this plays, Good Luck !
Disclaimer: The information presented in this wave analysis is intended solely for educational and informational purposes. It does not constitute financial or trading advice, nor should it be interpreted as a recommendation to buy or sell any securities.

EFERT PROBABLY IN WAVE '' 3 '' OR " C " - LONGEFERT is most probably in wave 3 or C of a higher degree wave 4 or A, if our wave count is correct then wave 3 or C is almost ending and prices should take support from 165-160 range level.
Alternately prices can go toward our main buy zone directly i.e. 160-140 range in which the prices might reach 145-140 level easily but our preferred setup suggests that prices will take support around 165-160 range bouncing of the yellow trendline.
We will take a small position at 165-160 level and if prices goes further down we will add more at 145-140 level, based upon our little knowledge we find EFERT fundamentally strong and reasonable at prices around 160-140 but of course cheaper is always better.
If our wave count is correct then we can make around 12% to 21% on this trade.
Trade setup:
Entry price: 165-160
Stop loss: we will update stop loss once prices start to rise from our buy zone
Targets:
T1: 185-195
Let see how this plays, Good Luck!
Disclaimer: The information presented in this wave analysis is intended solely for educational and informational purposes. It does not constitute financial or trading advice, nor should it be interpreted as a recommendation to buy or sell any securities.

Still a Good Buy but with proper Stoploss.Still a Good Buy but with proper
Stoploss.
Immediate Resistance is around 134 - 135
Crossing it may take the price towards
140 - 144 initially. & then the Double Bottom
will play and may hit 160+

Lower Locked at 58.40 today.
Lower Locked at 58.40 today.
58 is an Important Support but
if it is not respected we may witness
price around 48.
as mentioned earlier, it should stay above 36
otherwise extreme selling cab be seen.


Hidden Bullish Divergence will play?as mentioned during market
timings, 36.50 was important to
sustain. It could not and hit the
Lower Lock at 36.03
Next Support is around 34.50 - 34.62
Now it is Important to Sustain 36.50 - 36.70
on Weekly basis.
Monthly Support is around 35.
One +ve sign: Hidden bullish divergence has
also appeared.

AVN is BullishPrice was in a downtrend consistently printing lower highs and lower lows. However, a bullish divergence on daily timeframe hints the return of bulls, and if previous lower high is broken with good volume then we can expect a bullish breakout as per Dow theory. Targets are mentioned on the chart.

Waves - Bull FlagPSX:WAVES forming Double Bottom on Daily TF and breaking out of Bull Flag accumulation. AL and Targets mentioned.

Play on LevelsImmediate Resistance is around 360 - 361
Weekly Closing above this level would be
a +ve sign & may move the price towards 385 - 387

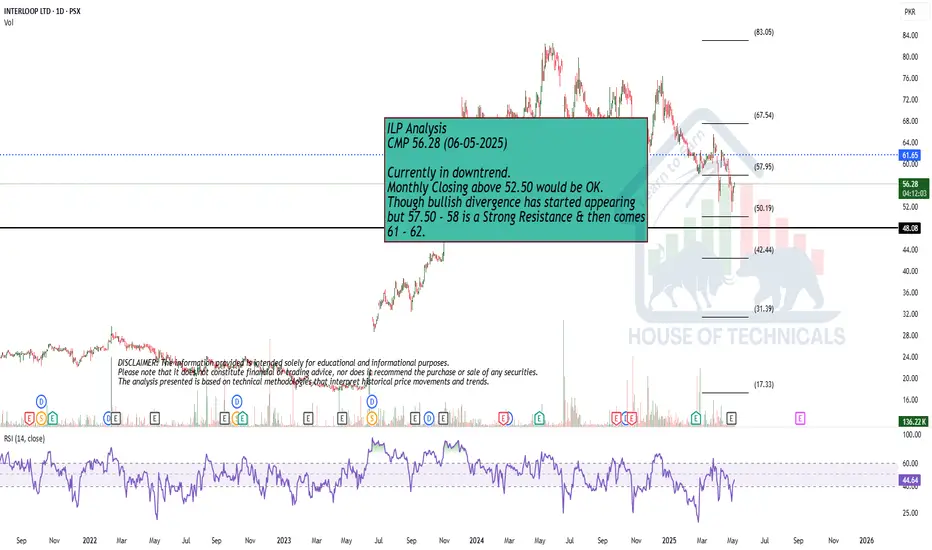
Currently in downtrend.Currently in downtrend.
Monthly Closing above 52.50 would be OK.
Though bullish divergence has started appearing
but 57.50 - 58 is a Strong Resistance & then comes
61 - 62.