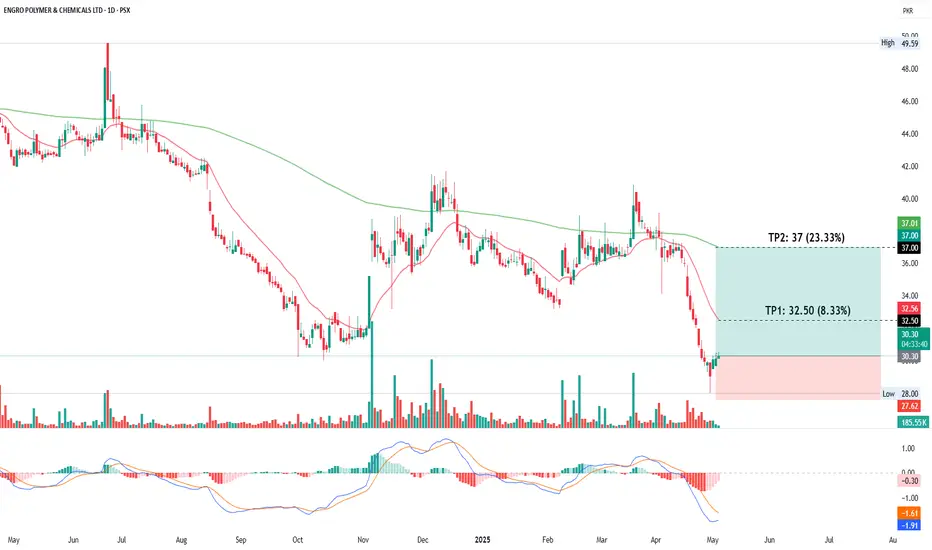
EPCL Shows Bullish Reversal Potential with MACD Crossover & EMAThe daily chart of EPCL indicates a potential bullish reversal. The price recently rebounded from a low near 28 and is now trading at 30.50, showing signs of recovery. The MACD indicator is on the verge of a bullish crossover, suggesting increasing upward momentum. The immediate target (TP1) is 32.50, which aligns with the 20-day EMA, while the second target (TP2) is set at 37.00, corresponding to the 200-day EMA. These levels represent 8.33% and 23.33% potential gains, respectively, and may serve as key resistance levels in the short to medium term.
Morning Star formationMorning Star formation
Weekly Closing above 125 would be positive.
However, 143 - 144 is the resistance zone.
Crossing it with Good Volumes will move the
price towards 155 - 160.

DGKC | Is This Cup & Handle Pattern?Here we have a classic pattern and price dynamics. A major high leads to a low and then a recovery wave. The recovery wave peaks before reaching the previous high and this reveals that a new drop is approaching.
Trading volume is low on the current rise and the latter part of it goes into a parabola. A parabola can only end in a retrace.
DGKC is now set to produce a correction, this correction is set to develop in the short- to mid-term.
RSI indicator if at over bought level while MACD is line is above the signal line, and can show a cross over which establish some negative stance on the price.
Fibonacci levels for the support are PkR123 (0.382 level) and PkR119 (0.5 level) from where a pull back can be expected
On the flip side, if the price gives a break out and closed above PkR137 level then only new bullish wave is expected.

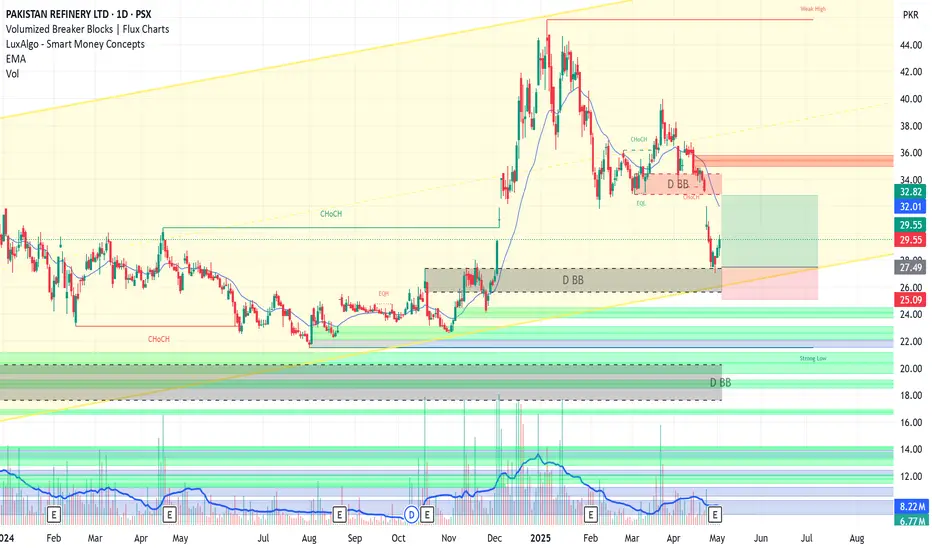
PRL LONG TRADEPRL has confirmed its bounce from bottom of upward channel and Breaker Block
It's short term high probability trade
Buy PRL 27.5-29.5
TP 32.8
SL 26.6
SNGP buying StrategyBuy Recommendation:
- Current Price: Rs. 124.94
- Suggested Buy Range: Rs. 123-118 (on dip)
- Stop Loss: Rs. 116
- Target Price: Rs. 135


SNGP IS ON THE RISESNGP is rising despite of the fact that market is in pressure, price has taken a good correction and now showing bullish signs, buying is a good option at current price.

Should wait for Resistance Breakout.
Accumulate with Stoploss 13.30
Targets can be around 17 & and then 20.
Resistance is there around 16.50.
Those who cant hold , should wait to Cross 16.50

Very Good Weekly Closing.
Very Good Weekly Closing.
Monthly Closing above 780 is Important,
otherwise, Tweezer Top is Expected which
is a Negative sign.
Channel Top is around 825 - 830.
Initial Support seems around 700 - 705.
& Double Bottom (in case of Selling Pressure)
is around 640 - 645 (which may also act as Support).

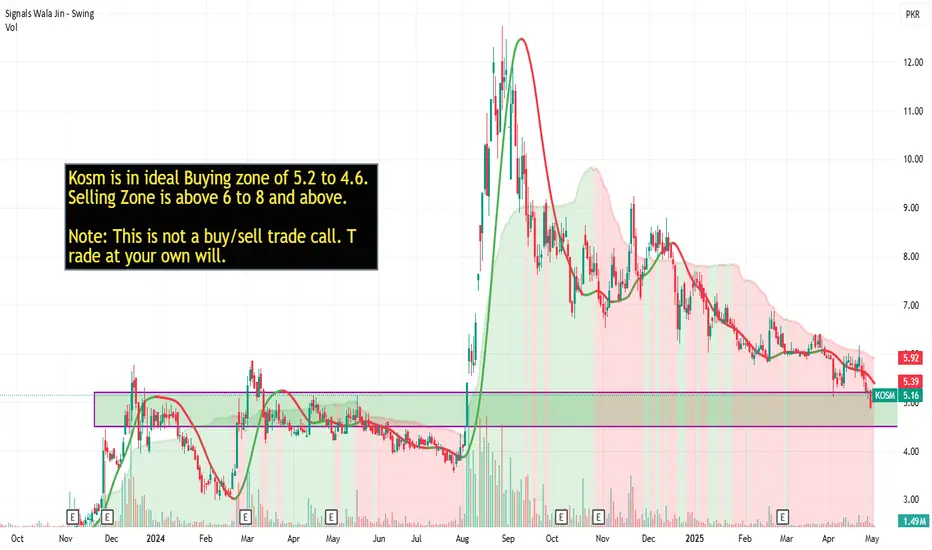
Kosm is in ideal buying zoneKosm is in ideal Buying zone of 5.2 to 4.6. Selling Zone is above 6 to 8 and above.
Note: This is not a buy/sell trade call. Trade at your own will.
Netsol is in ideal buying zoneNetsol is in ideal buying zone of 130 and 117. Its selling zone is 140 to 154.
Note: This is not a buy sell trade call, trade at your own analysis and will.

Pace is in ideal buying zonePace is near to 4.88 a strong support level. it is ideal zone for buy it. Currently at 5.02 level and it could reach its strong resistance level of 5.62 and 6.36 level.
Note: This is not a buy/sell trade call. trade at your own will and analysis.

CNERGY | Rising Wedge & Bearish Divergence!Two sign of danger
Rising Wedge Pattern and Bearish Divergence with Volume indicator
Rising Wedge Pattern:
Characteristics: Converging trend lines with higher highs and higher lows, narrowing range.
Interpretation: Bearish reversal pattern, weakening buying pressure.
Trading Strategy: Short selling after break below lower trend line, set stop-loss above upper trend line.
Confirmation: Decreasing volume and other indicators like RSI or MACD can add to bearish implications.
Bearish Divergence with Volume:
When you see a price increase accompanied by decreasing volume in technical charts, it's often considered a bearish sign.
Weakening upward momentum: Decreasing volume during a price increase can indicate that the upward momentum is losing steam. This could be due to a lack of buyers or interest in the stock at current prices.
Potential reversal: A price increase on low volume might suggest that the trend is about to reverse. If there's not enough buying pressure to sustain the price increase, sellers might step in, causing prices to drop.
False breakout: Decreasing volume during a price increase can also indicate a false breakout. If the price breaks out above a resistance level on low volume, it might not be a genuine breakout, and prices could fall back below the resistance level.

Mari Swing trading targetsMari is entered into bullish trend and entry is possible, TP1 is 660 and TP2 is 700. SL is 593.
Note: This is not a buy/sell trade call. trade at your own will and analysis. This is for education purpose.

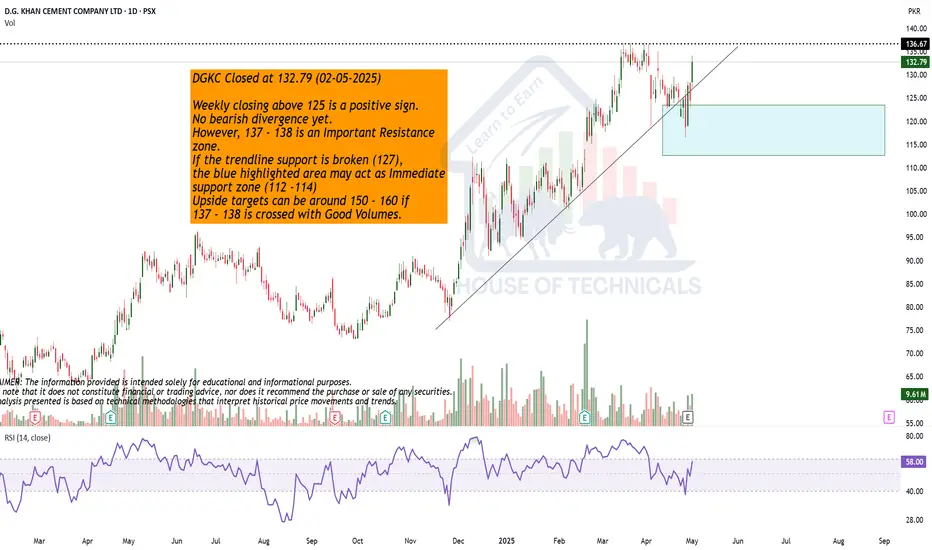
Play on Levels
Weekly closing above 125 is a positive sign.
No bearish divergence yet.
However, 137 - 138 is an Important Resistance
zone.
If the trendline support is broken (127),
the blue highlighted area may act as Immediate
support zone (112 -114)
Upside targets can be around 150 - 160 if
137 - 138 is crossed with Good Volumes.
ZAL Trade Plan – Strong Fundamentals & High Growth PotentialCompany Overview:
ZAL is fundamentally one of the strongest companies in the market, showcasing impressive growth driven by increasing sales and expanding profit margins. The company is actively scaling its operations, which sets the stage for even greater future earnings. Given its solid financials and business expansion, ZAL holds significant potential for capital appreciation.
Growth Outlook:
With a strong earnings trajectory and business development initiatives, the stock price has the potential to generate gains of 40–70%, depending on the size of the upcoming rally.
✅ Trade Setup
Entry Options:
Breakout Entry: Buy on a confirmed breakout with closing above Rs. 17
Dip Entry: Buy between Rs. 15.20 – 14.50 (ideal accumulation zone) , CZ it will form the right Shoulder of Head and shoulder Pattern
Risk Management:
Stop-Loss: Rs. 13 (to manage downside risk)
Take-Profit Levels:
TP1: Rs. 16.50
TP2: Rs. 19.00
TP3: Rs. 22.00
TP4: Rs. 24.00
📌 Note: Follow proper risk management and position sizing based on your portfolio. Monitor price action and volume closely around the breakout level for confirmation.

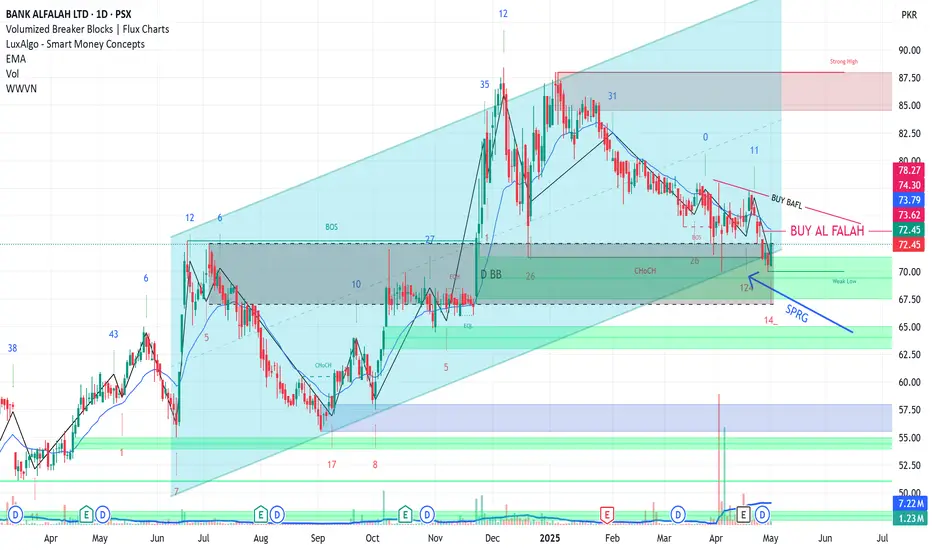
BAFL LONG TRADEBAFL has been in uptrend channel since long
It has touched its bottom and given positive rebound yesterday
It just needs one more green candle confirmation above 73
Buy BAFL if it crosses 73.5
TP 84
SL 68
SSGC LONG TRADESSGC has rebound from trendline, it's continuously in uptrend
Buy SSGC 39-41
TP 44.5
SL 37.9

Bullish divergence in ENGROHBullish divergence is observed in the daily timeframe for ENGROH. The current downtrend is expected to reverse after the bullish divergence. The current downtrend is likely to reverse into an uptrend and reach levels indicated on the chart. When the trend starts to reverse and breaks the entry point level indicated on the chart, it will be considered a confirmation of the trend reverse and a good point to take a long position.

Monthly Support.Important to Sustain 529 on Monthly basis.
It may hit 472 - 475 in worst case scenario.
The Bullish divergence on shorter tf may
move the price up towards 550 - 555.

Make it or Break it Situation.
Make it or Break it Situation.
Either it will reverse from the current
leve or it may touch 1235 - 1240.

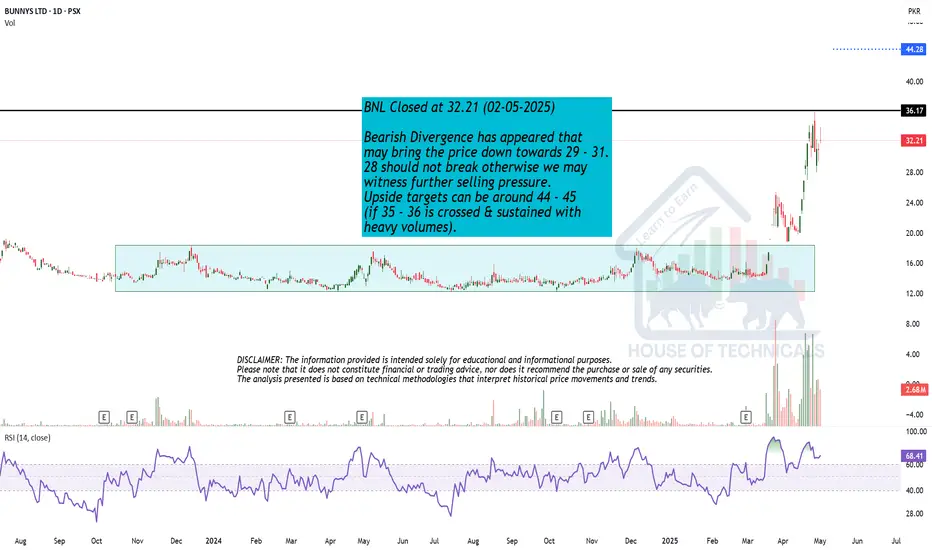
Bearish Divergence has appeared.
Bearish Divergence has appeared that
may bring the price down towards 31 - 32.
28 should not break otherwise we may
witness further selling pressure.
Upside targets can be around 44 - 45
(if 35 - 36 is crossed & sustained with
heavy volumes).
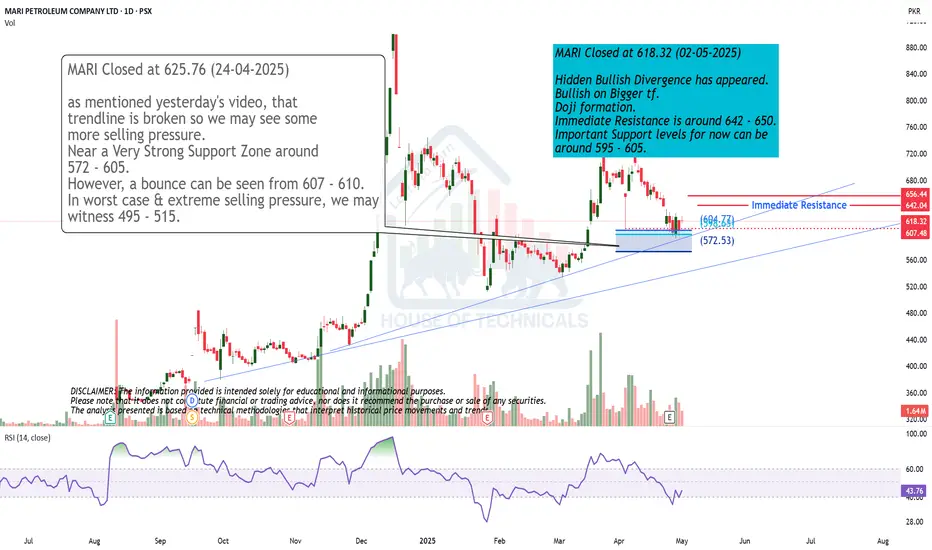
Hidden Bullish Divergence
Hidden Bullish Divergence has appeared.
Bullish on Bigger tf.
Doji formation.
Immediate Resistance is around 642 - 650.
Important Support levels for now can be
around 595 - 605.