Bearish Weekly Candle.Bearish Weekly Candle.
Capped & then heavy selling (today).
Last candle - Doji
Immediate Support Zone is around 58 - 63.
Reversing from this support zone would
expose 75 - 77 again.
Its safe as long as it stays above 36.

Bearish Divergence appeared.Bearish divergence appeared on Daily as well as
Weekly TF.
Strong resistance is there around 127 - 129.
Once this level is Crossed, we have open ways
towards 145 - 147
On the flip side, we have a good support around
120-122. However, breaking 116 this time will bring
more selling pressure towards 113 initially.

Bullish on bigger time frames.
Bullish on bigger time frames.
Took support from a very important
level around 36-37.
HL printed.
40.30 - 40.85 is a Resistance level as
of now.
If it gets rejected from this level, we may
witness 37.50 - 38.50 again.
Upside targets can be around 45 - 46 & then
50s.

BFBIO is entered into Bullish ZoneBFBIO is entered into bullish zone and may be it will cross 150 and 200 levels in few days. Stop loss is 118.
Note: This is not a buy/sell trade call. Trade at your own will.

Searl entered into Bullish zoneSearl is entered into Bullish zone and may it cross 90 and 95 levels in few days. Stop loss could be 80 and 78.
Note: This is not a buy/sell trade call. Trade at your own will.

AVN in Bearish trend AVN in Bearish trend about to face a trend reversal RSI diversions can be seen. Entry with a buy stop above the last lower high

DGKC entered into bullish zoneDGKC is entered into bullish zone,
Note: This is not a buy/sell trade call.

Gal entered into Bullish zoneGal is entered into bullish zone and may gross 500 and 550 level.
Note: This is not a buy/sell trade call, it is for education purpose, use stop loss.

PAEL SETUP ONCE AGAINPAEL is currently at its orderblock zone where the liquidity is resting if volumes come in at this level then we can expect a bounce again if the orderblock fails and there is no liquidity in OB then wait for downside levels and if the weekly ema 21 is broken then i see 30 level coming but still we will look into some more levels for now just focus on this orderblock
the previous supply is completed here

HH HLMonthly Closing is good.
Weekly closing above 29.50 would
be very positive sign.
32 is the Immediate Resistance &
if 36.10 is Crossed & Sustained with
Good Volumes, we may witness 40 - 45.

PSO Facing Trendline Resistance – Possible Retracement AheadMollyRonaldFx Report
The PSO 15-minute chart shows a strong bounce from recent lows, with price currently testing a well-defined descending trendline. Although today’s movement reflects bullish momentum (+2.22%), the resistance at this trendline may trigger a pullback. The projected short-term scenario indicates a potential dip towards the 348 support zone. A failure to break and hold above the trendline could confirm this bearish move. Watch price action closely near the resistance area for confirmation.

AKBL buying opertunity AKBL Buying Opportunity:
Analysis:
1. *Support Level*: AKBL shows strength on support, indicating potential buying interest.
2. *Buying Range*: PKR 37-34 seems like a reasonable entry point.
3. *Stop Loss*: PKR 32 provides a buffer against potential losses.
4. *Target Prices*: PKR 40-42 and PKR 45 offer potential
Next Steps:
1. *Monitor AKBL's Performance*: Keep an eye on AKBL's stock price and adjust strategy as needed.
2. *Stay Informed*: Stay up-to-date with market news and analysis.

ENGROG LONG TRADEENGROH has taken support from its long term trendline.
Though it gave a good bounce but still it needs positive closing above 169 tomorrow
Buy if it crosses and sustains above 169
TP 196
SL 161

Consolidation BoxBBFL Closed at 53.24 (25-04-2025)
Currently in consolidation box.
Crossing 55 - 56 may lead it towards 63 - 65 initially

Approaching important Support Zone..Important to take Support from
this Level ( 21.30 - 22.50).
Otherwise more selling pressure
will be observed.

Should wait for a Proper SupportImportant Support @
Channel Bottom
One should wait for a proper support level to take entry.

Channel bottom Support Taken...Important to Close above 40.84
on Monthly Basis for further
Upside.
Channel top is around 44 - 45

Strong Bullish DivergenceStrong Bullish Divergence has appeared.
If today's low is not broken,we may witness 173 - 175 initially
& then around 180 - 185.

BBFL Stock Reversal: From Consolidation to Breakout RallyThe chart for Big Bird Foods Limited (PSX: BBFL) illustrates a classic market cycle with a notable reversal pattern. Initially, the stock experienced a prolonged downtrend, forming a rounded bottom between late 2024 and early 2025. This was followed by a range-bound consolidation phase, indicating accumulation by market participants. Around May 2025, a bullish breakout occurred, pushing the price above the resistance zone and confirming the reversal. Since then, the stock has shown a strong uptrend with higher highs and higher lows, supported by an upward-sloping curve, suggesting increasing momentum. The shaded projection area indicates a potential bullish continuation, with price targets potentially reaching above PKR 87 if the trend holds. Key support lies around PKR 44–49, which would be crucial for trend sustainability in case of a pullback.

BOP Trade SetupThe stock has recently corrected towards its 200-day EMA, currently positioned at PKR 8.99, and has shown signs of stabilizing near this key long-term support level. Historically, the 200 EMA often acts as a strong bounce zone, especially in stocks that have previously demonstrated bullish momentum.
The recent downtrend appears to be losing strength, with declining red volume indicating possible seller exhaustion. A rebound from current levels could signal a short-term trend reversal, offering a favorable risk-reward setup for swing traders.
With moderate volume support and price action indicating potential consolidation, BOP presents a compelling opportunity for investors looking to enter near support with clearly defined risk parameters.

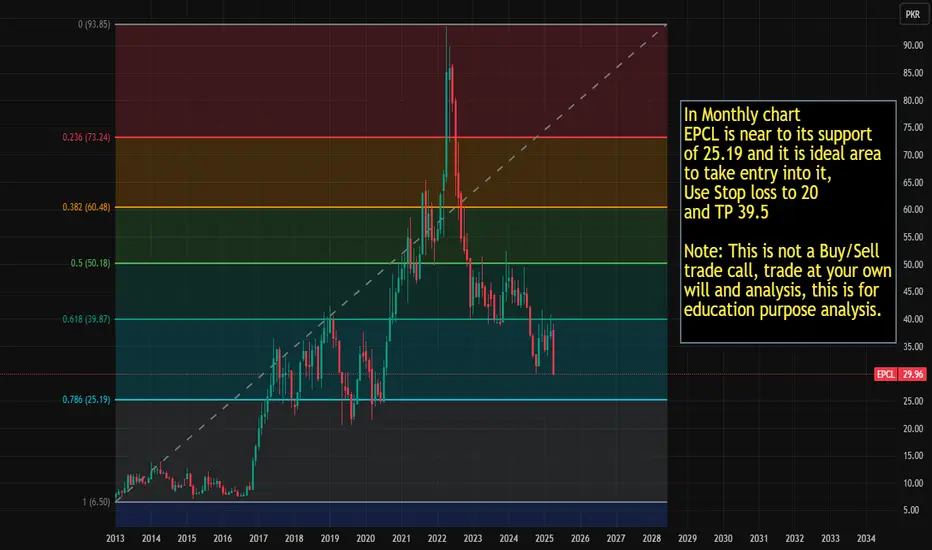
EPCL is in ideal range for entry. In Monthly chart EPCL is near to its support of 25.19 and it is ideal area
to take entry into it, Use Stop loss to 20 and TP 39.5
Note: This is not a Buy/Sell trade call, trade at your own will and analysis, this is for education purpose analysis.
SSGC | Downward-Sloping ChannelThe stock in a downward-sloping channel after a strong rally that peaked near PKR 50.87. Currently trading at PKR 39, the price is above the 200 EMA level (28.70 PKR), suggesting longer-term bullish strength despite short-term weakness. Recent price action faced resistance near the upper trendline, and today's bearish candle indicates selling pressure. Key support lies around 37.00–35.00 PKR, while a breakout above 41.00–43.00 PKR could signal a resumption of the uptrend if backed by strong volume.

GHNI BUY IDEA.AS per the Elliot wave theory we are in the 5th leg which is targeting 950 rs.
As of the current scenario , we are trading in a bullish parrallel channel.
with Hidden divergence formed + emas merging on this point we can expect a good bull move from 710-720 rs , targeting abv highs.
A bullish candle will be very good.
