BFBIO- LEAST RISK HIGH PROBABILITY LONG TRADEBFBIO successfully completed its correction and broken its downward resistance line.
Very low risk trade.

GLAXO-SHORTAfter double top now it will take correction so take exit in time and buy at target when it reached.

UNITY | Parallel Channel On Weekly Time FrameThe price is moving in a parallel on the daily timeframe, indicating a potential massive bullish rally. Showed a pull back from 200-day EMA and currently 4% up. We anticipate a 45% bullish wave in the coming days.
Trading Strategy
- Entry: Consider long positions at 27.50
- Stop-loss: Set at 23.93, just below the support level
- Risk-reward ratio: 1:3.5
- Swing Trade Target Level: 40
Trading Reminder
- Assess your risk and calculate potential losses before entering any trade.
- Trade wisely and only enter positions that align with your strategy and risk tolerance.
- Stay calm and avoid impulsive decisions driven by FOMO. Trading is a long-term journey.

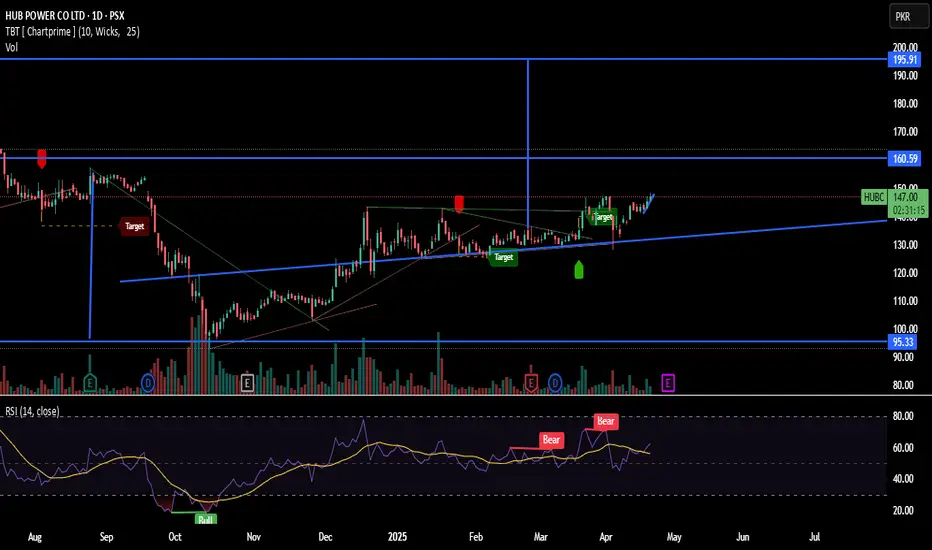
HUB POWER CO LTD (PSX: HUBC LONG IDEATargets:
160.59 PKR — This is the first key resistance level and a clear target, where the price might face selling pressure.
195.91 PKR — Major upper target or longer-term resistance zone, if the momentum continues.
💪 Supports:
95.33 PKR — Strong historical support, price has bounced from this level before.
Around 135-138 PKR — This area, marked by the blue trendline, is acting as dynamic support as the price respects the upward trend.
📊 RSI Insight:
RSI is at 62.38, which is heading toward the overbought zone but still has room for upside.
Watch for an RSI break above 70 for overbought or below 50 for potential weakness.
The chart shows a bullish breakout above minor resistance, approaching 147 PKR now. If it sustains above this, 160.59 looks like the next pit stop.
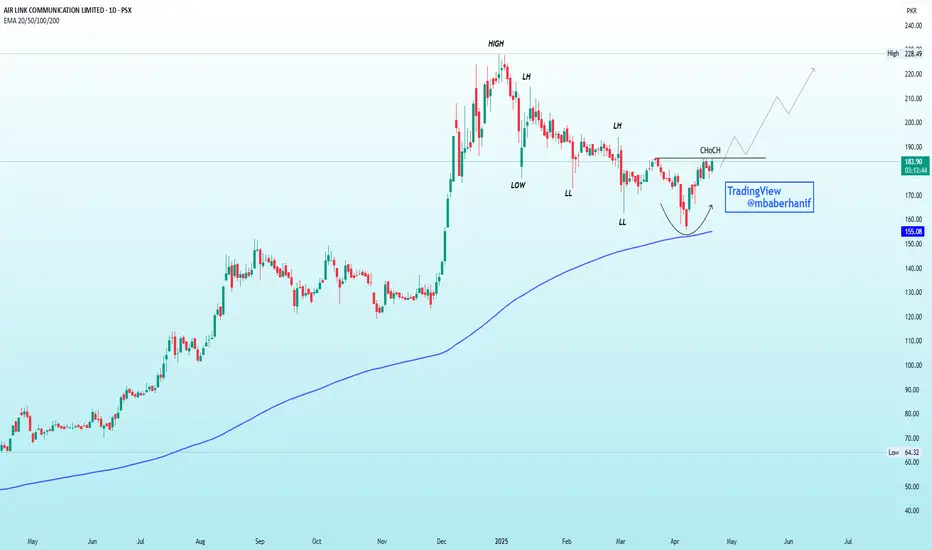
AIRLINK | An Imminent Reversal!!!Previous Trend: Bearish, confirmed by Lower Highs (LH) and Lower Lows (LL).
CHoCH (Change of Character): Bullish signal—price broke previous LH.
Pattern: Rounded bottom forming near the 200 EMA (~155), acting as strong support.
Volume: Slight pickup near bottom—early sign of accumulation.
Outlook: Bullish reversal likely. Break above CHoCH with volume confirms uptrend.
ATLH - Breakout ATLH breakout of long resistance trendline. Buy now or at retest to target 1300-1400 area (TPS marked)

Let the Resistance Cross & Sustain!Bullish Divergence on Weekly as well as Monthly TF.
Hidden Bullish Divergence on Daily TF.
Immediate Resistance is around 8.20 - 8.30
Important Resistance Zone 9.80 - 10.90
Crossing & Sustaining will expose 13 - 13.50 initially.

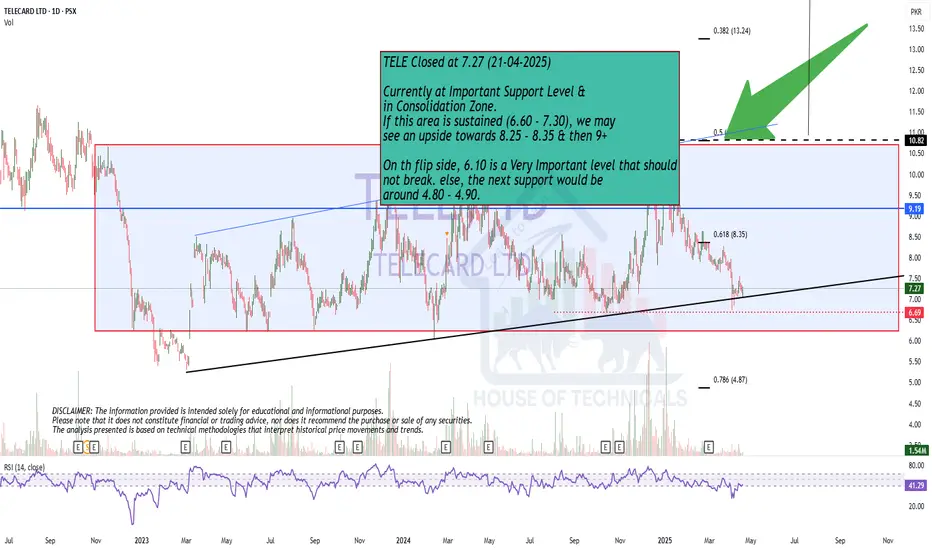
Currently at Important Support Level..
Currently at Important Support Level &
in Consolidation Zone.
If this area is sustained (6.60 - 7.30), we may
see an upside towards 8.25 - 8.35 & then 9+
On th flip side, 6.10 is a Very Important level that should
not break. else, the next support would be
around 4.80 - 4.90.
FFC : Bullish Divergence Trading Setup (Hourly Time Frame)A Bullish Divergence has been identified between Price and Momentum indicators on the Hourly chart, signaling a potential Bullish Reversal. This divergence suggests weakening downside momentum and increasing probability of an upward move.
Entry levels and Target Prices (TPs) are clearly marked on the chart.
Traders are advised to consider the Stop Loss (SL) at the level indicated on the chart to manage risk effectively.
This setup favors bullish positioning with calculated risk-reward parameters. Monitor price action around the entry zone for confirmation before execution.

EFERT : Bullish Divergence Trading Setup (Hourly Time Frame)EFERT : A Bullish Divergence has been identified between Price and Momentum indicators on the Hourly chart, signaling a potential Bullish Reversal. This divergence suggests weakening downside momentum and increasing probability of an upward move.
Entry levels and Target Prices (TPs) are clearly marked on the chart.
Traders are advised to consider the Stop Loss (SL) at the level indicated on the chart to manage risk effectively.
This setup favors bullish positioning with calculated risk-reward parameters. Monitor price action around the entry zone for confirmation before execution.

SUI SOUTHERN GAS CO LTD SSGS has good potential to grow more because of current government in Pakistan try their best resolve the issue of circular debt SSGS is the one of beneficiary of circular debt.
1) Currently SSGS share price following Dow theory of uptrend.
2) Volume on daily time frame showing strong sentiment for future grow.
3) Completed 50% retracement of fib`s , Show strong reverse from golden number of fib.
4) Following AB:CD pattern on daily, weekly and monthly time frame, while completed (C) leg of AB:CD pattern and started to follow ( D) leg.
5) Also seen cup & handle pattern of daily, weekly time frame, currently following to complete handle of cup and handle pattern.
6) According to Elliot impulse theory completed 2nd leg and started 3rd leg which can expect more higher than past one.
Trade Plane
AB:CD Pattern Targets
Target (1) : 50.54
Target (2) : 72.00
Stop loss : 29.80
Cup & Handle Targets
Target: 89.45

SYM. .... Resumption of Uptrend ??Observe price between 12.50 and 11.88
Once price gets a regection on daily TF with a pin bar and High Volume , Buy trades with Target upto 20,30 and 42 are expected.

TRG, Buy Opportunity is coming up !Buy once price closes above BB50
Price target1: 92.59
Price Target2: 150

MTL LOW RISK LONG TRADEMTL has given breakout of its downward channel and also taken support from a long term trendline, furthermore it also successfully established a Spring. It is low risk trade.
Buy MTL 600-620
TP1 690
TP2 760
SL 580

SLGL LONG TRADESLGL has recently completed its 61% correction and has now confirmed its reversal with a Spring in Golden Zone which lies exactly on FVG. It is considered High Probability Trade
Buy SLGL @ 15.1 and 14.2
TP 17.9
SL 12.8

SYMMETRY GROUP LTD LONG IDEAGolden Cross Strategy (50, 200 MA)
Two moving averages are plotted: a 50-day (likely the green line) and a 200-day (likely the blue line).
The current price ₨14.19 is below the 50-day moving average (₨16.11) and the 200-day moving average (₨12.24). This suggests the stock is trading in a weak zone relative to its medium-term trend.
Support & Resistance
Price recently broke below a key upward trendline, shown as a blue diagonal line sloping upwards.
The stock seems to be testing this broken trendline as resistance.
Trade Markers
Several "Target" labels (green and red) appear on the chart, showing past trading signals.
Green icons indicate successful bullish targets; red icons indicate bearish signals or failure to sustain levels.
RSI (Relative Strength Index)
RSI is shown at 40.23, slightly below the neutral 50 level.
There’s also a yellow moving average line for RSI, currently at 36.19.
The RSI has been in a bearish phase since early 2025, with occasional “Bear” and “Bull” signals marked on the indicator. Recently, the RSI made a small uptick, but still stays below the 50 mark, which hints at weak buying strength.
⚡ Insights
Trend Weakness: The price has broken below a long-standing ascending trendline and is struggling to regain that line as support, which is a bearish technical signal.
Bearish Momentum: The RSI is under 50, showing weak bullish momentum and limited buying interest.
Resistance Overhead: The 50-day moving average around ₨16.11 and the downward-sloping trendline are likely to act as resistance in the near term.
Possible Bottom Formation: If the RSI holds above 36 and starts climbing, combined with price stabilizing around ₨14.19-₨12.50, a short-term reversal could happen — but confirmation is needed.
✅ Actionable Takeaways
For Traders: Avoid long positions until the stock breaks above ₨16.11 (50 MA) or shows a clear bullish RSI crossover.
For Investors: If you’re looking for value, watch for a base formation near the ₨12.24 (200 MA) region.
For Short Sellers: As long as the price remains below the 50-day MA and the RSI doesn't cross 50, bearish setups remain favorable.

HH HL on bigger Tf but now..HH HL on bigger Tf but now
Bearish Divergence appearing also.
50 is the Resistance for now.
Those who are already holding it should
keep their stoploss at 40 (in extreme case).

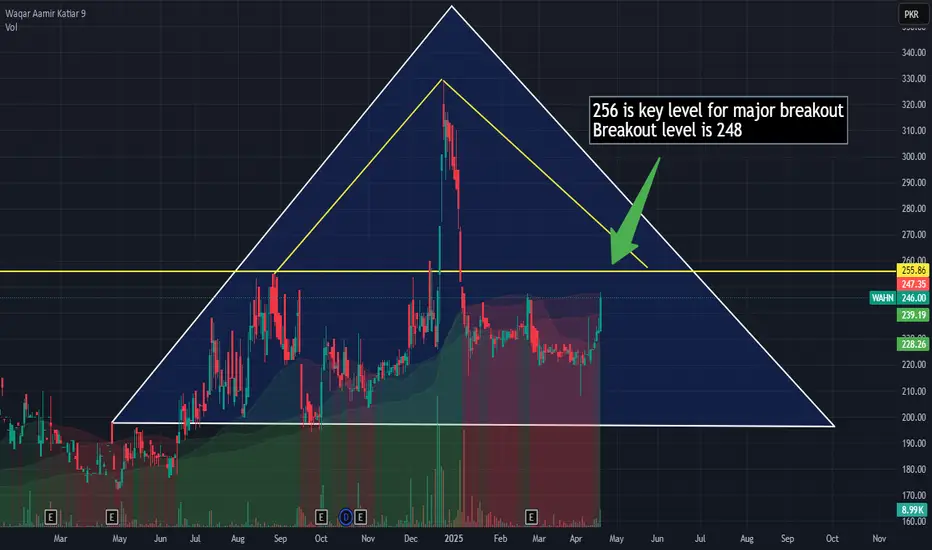
Wahn is near to brakout level. Wahn is near to breakout level of 248 and if it crosses 256, it could be a major breakout for flying again.
Use stop loss and this is not a buy sell call, trade at your own will.
SAZEW SAZGAR PSXSazew has breakout after today strong financial result for Q32025 which is more than 100% and dividend is announced too, due to which it shows great potential for next targets.

Interloop - ILP: Potential Bullish The chart for Interloop Limited (ILP) shows the stock currently trading within a downward-sloping channel, with clear support at 59.14 (marked by the yellow line) and resistance at 61.42. The price has been consistently testing the lower boundary of this channel, and the support level at 59.14 has held in the past, indicating it could offer a potential bounce. If the stock manages to hold above this support, it could initiate an upward move.
A breakout above 61.42 would be a strong bullish signal, suggesting the stock could continue to rise towards the next resistance levels around 64.00 or higher. However, if the price fails to maintain support at 59.14, it could slide further down to 52.86, marking the next significant support level.
Overall, the stock is in a downtrend, but the current setup provides an opportunity for a potential reversal if it successfully breaks the resistance and holds above support.

Good Support168 - 172 is a Very Strong Support Level.
However, 176-177 is an Important Resistance
on Weekly Basis.
Weekly Closing above 170 would be a Positive Sign.

Bullish on All Time Frames; butBullish on All Time Frames; but
Strong Resistance lies around 12 - 12.20
Those who are Holding, Must Trail their
Stoploss to 10.30 (at least)
Though there is Hidden Bullish Divergence, but
Strong Resistance is lying ahead.
Those who want to Take Fresh Entry, should
wait for 12.20 to Sustain.
One thing to note is a Bearish Divergence on
Daily TF. But since this is on Daily TF, so slight
Pressure may bring buying Opportunity (as long as
it stays above 8.)

Currently Near Resistance.67 - 68 is a Very Strong Resistance.
We may witness Selling pressure towards
55 -58.
Though it is Currently Bullish, but Fresh
Entry is not recommended unless 68 - 69
is Crossed & Sustained with Good Volumes.
