Bullish on All Time Frames; butBullish on All Time Frames; but
Strong Resistance lies around 12 - 12.20
Those who are Holding, Must Trail their
Stoploss to 10.30 (at least)
Though there is Hidden Bullish Divergence, but
Strong Resistance is lying ahead.
Those who want to Take Fresh Entry, should
wait for 12.20 to Sustain.
One thing to note is a Bearish Divergence on
Daily TF. But since this is on Daily TF, so slight
Pressure may bring buying Opportunity (as long as
it stays above 8.)

Currently Near Resistance.67 - 68 is a Very Strong Resistance.
We may witness Selling pressure towards
55 -58.
Though it is Currently Bullish, but Fresh
Entry is not recommended unless 68 - 69
is Crossed & Sustained with Good Volumes.

Cyan is above breakout level of 33.27Cyan is above breakout level of 33.27 and expected to cross 45 and 50 levels.
Note: This is not a buy/sell trade call. Trade at your own will. Use stop loss too.

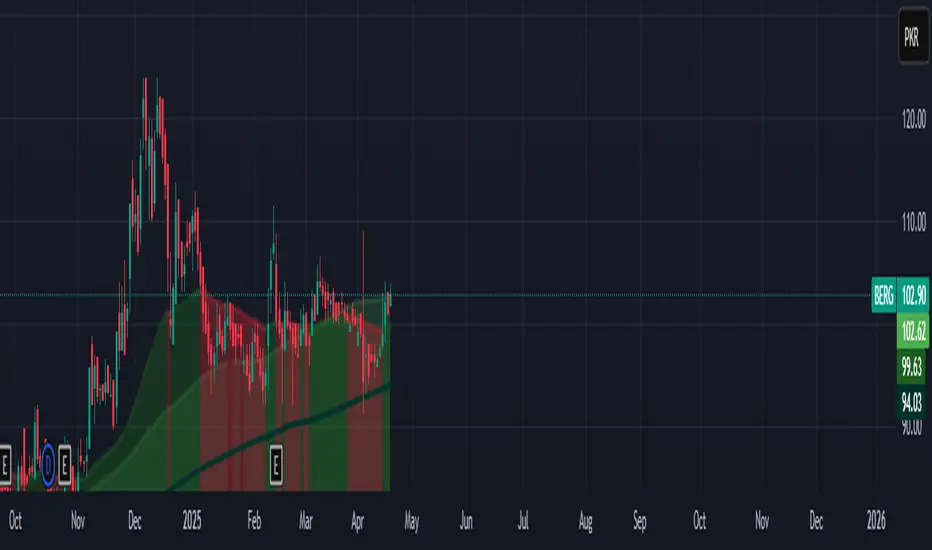
Berg is above breakout level of 102.62Berg is above breakout level of 102.62 and may cross 120 and 140 levels.
Note: This is not a buy sell trade call. Trade at your own will. Use stop loss.
Quice is above breakout level of 6.73Quice is above its breakout level of 6.73 and it crosses trendline too. It can cross level of 8 and 10.
Note: This is not a buy sell call. Use stop loss too.

Mtl is above breakout level of 624Mtl is above breakout level of 624, and it is expected to cross 650 and 700 level.
Note: this is not a buy sell trade call. Trade at your own will and use stop loss.

BNL - MULTIBAGGER ??
Current Price: 22.24
Chart Setup: Bullish Pennant and Breakout Pattern
BNL (Bunny's Ltd.) is currently showing a bullish pennant pattern, which is a continuation chart pattern that suggests a potential breakout to the upside. The price has been consolidating after a strong rally, forming a symmetrical triangle or pennant shape, with the upper boundary acting as resistance and the lower boundary as support. The breakout from this pattern is typically a sign of further upward momentum.
First Target (50% Extension): Once the breakout happens, the first target range for BNL could be around 25.48, followed by a potential move toward 28.50 in the medium term.
Extended Target: If the breakout holds and the bullish momentum continues, BNL could test higher resistance zones around 30.00–32.00 in the long term.
BNL OUR FIRST CALL INITIATED @ 14 LEVELS IN MARCH

GHNI - CONTINUES TO B UPWARD, IS IT HEADING FOR 1000+ ???
Current Price: 764.04
Chart Setup: Uptrend within an Ascending Channel
Ghandhara Industries Ltd. (GHNI) has been experiencing a strong bullish trend, moving within an ascending channel over the past year. The stock has shown significant upward momentum, consistently bouncing between the support and resistance levels of the channel. Currently, it is nearing the upper resistance line, suggesting that further upside could be expected if the trend continues.

IBLHL (MONTHLY) - THREE INSIDE UP IBL Healthcare Ltd. (IBLHL) is showing significant bullish potential after a long downtrend, with a "Three Inside Up" candlestick pattern forming at the bottom of the trend. This pattern suggests a potential reversal to the upside after a prolonged period of decline, and it signals strength as the buyers are beginning to take control.

LUCKY cement Lucky cement gave break out and started making a bullish trend as per the principles of Dow theory.It is making new higher highs and higher lows while sustaining a good upward movement.

PSX: INIL Outlook INIL about the complete the consolidation phase and breakout confirm will start from channel breakout by sustaining above 164 level then breakout with strong candle 172 level for further confirmation.
Entry : 172
TP1: 190
TP2: 208
TP3: 226

LOADS--- a Short Term Yet Powerful Trade Loads is offering a powerful Buy Set-up with following confluences:
1. Pirce has broken out range and re-tested it.
2. Re-test of Breakout range with healthy price action (Pin-Bar)
3. Surge in Volume after a bounce-off price from breakout zone.
4. MACD & RSI have generated a Buy Signal.
5. Rejection of Price at lower boundary of BB.
Target Prices are 19, 21 & 25.

DGKC Long positionI shared the graph earlier where DGKC achieved all my targets from 82 to 107.
Now it has retraced at a very good rate, getting a 30% to 40% gain.
Stop Loss is 89 and targets are 126 and 133.

Double Bottom formed around 164 - 165.
Double Bottom formed around 164 - 165.
Crossing & Sustaining 179 may lead it
towards 190 - 193.
For a Bullish Momentum, it needs to Cross
195 atleast.

Bearish Divergence has started appearing
Bearish Divergence has started appearing
on Bigger Tf.
Channel Top is also there.
Stay Cautious.
Sudden Spike can be witnessed till 1450 - 1500
but that would be a Risky Trade to take.
So Better to wait till the Bearish Divergence
plays & bring the price down & settle (may be)
around 1000 - 1050

SPEL-LONGAfter a long consolidation now the time is pull up towards new High in time purchase and hold with patience then take rewards is the key of success.

SazewWith rising rsi, increased expectations of good profits and clean break out from consolidation, sazew looks good for medium to long term

TRG LONGTERM ANALYSIS AND NEW ALL TIME HIGH COMINGTRG has been in Pullback since May 2021 when it posted its ATH of Rs 186.
It has reached 78% level of retracement and is rebounding from !M FVG(Fair Value Gap).
It is very much likely to start a long term bullish move after it crosses Rs74 level to make new high of Rs 230 In Sha Allah

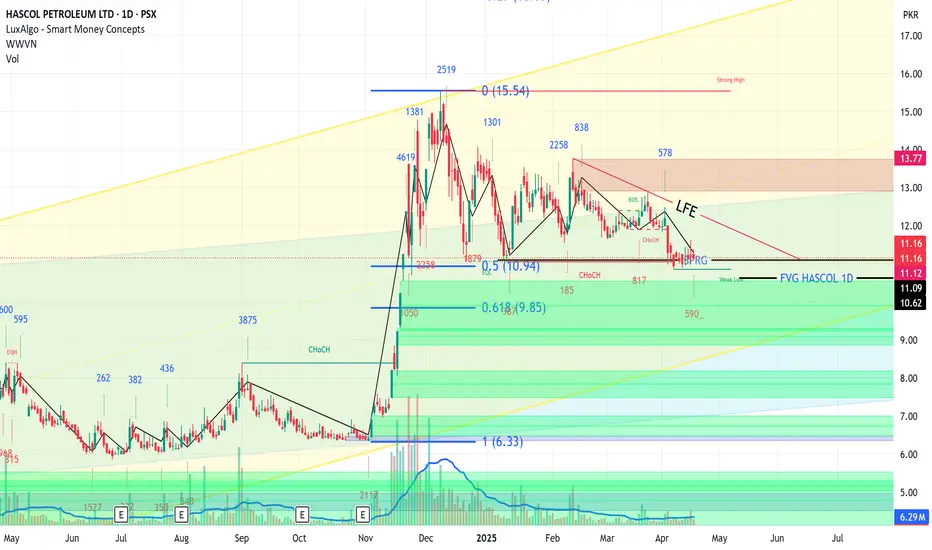
HASCOL LONG TRADEHASCOL has given breakout of previous channel ( blue ) and has now switched to new channel (yellow). It has completed 50% retracement of the breakout. I t is expected to rebound from current level or nearby FVG (Fair Value Gap) after going through spring/bear trap. It'll be a good buy only after some bullish confirmation. For now it is wait and watch strategy
HINO--- A High Probability BUY SwingTradePrice is currently at a High Probability Buy Zone with Target at 544 & 600. Confluences include:
1. BB-50 (Base line Retest and Rejection) on weekly TF.
2. RBS Zone overlapping with 61.80% to 78.6% Fib. zone.
3.Strong MACD Signal.
4. Surge in Volume on Daily TF at a key support area.
5. SL below 322

AGL -----Buy on the dip is coming up!Price is currently testing TL of daily TF for 3rd time.
There is possibility of fake breakout of this TL with price forming a pin-bar at TL on daily TF.
Once Price gets a bounce, a Buy around 56 to 60 with Target @ 76 is expecteed.

FFC- Deeper Retracement is Expected !Reasons for Deeper Retracements are :
1. 20, 50 & 200 SMAs are converging.
2. RSI on daily TF is below 30 which signifies Bearish Trend
3. Weaker Price Action at Recent Swing High is signalling Profit Taking activity is taking place.
Way Forward:
1. Observe Price Action once price tests 200 SMA and 78.6%% Fib. Level.
2.If a Bullish signal (Engulfing, Pin-Bar with surge in Volume) is observed, a good probability trade is on the cards.

No Bearish Divergence yet on Shorter TF.
No Bearish Divergence yet on Shorter TF.
Good Support is around 465 - 467.
However, Crossing 520 with Good Volumes
may lead it towards 600+
Even In worst case, it should not break 400.
