Hidden Bullish Divergence on Bigger tf.HTL Closed at 44.65 (13-05-2025)
Hidden Bullish Divergence on Bigger tf.
If 41 is not Broken, we may witness
upside towards 46.50 - 47 & then
50 to 55.

Extremely Bullish.Closed at 281.50 (05-06-2025)
Extremely Bullish.
But 289 - 290 is an Important Resistance.
Needs to cross & sustain 295 - 308 Zone for
further upside.
as mentioned in yesterday's video, 277 - 279
may act as Support.
Breaking 272 will bring more selling pressure.

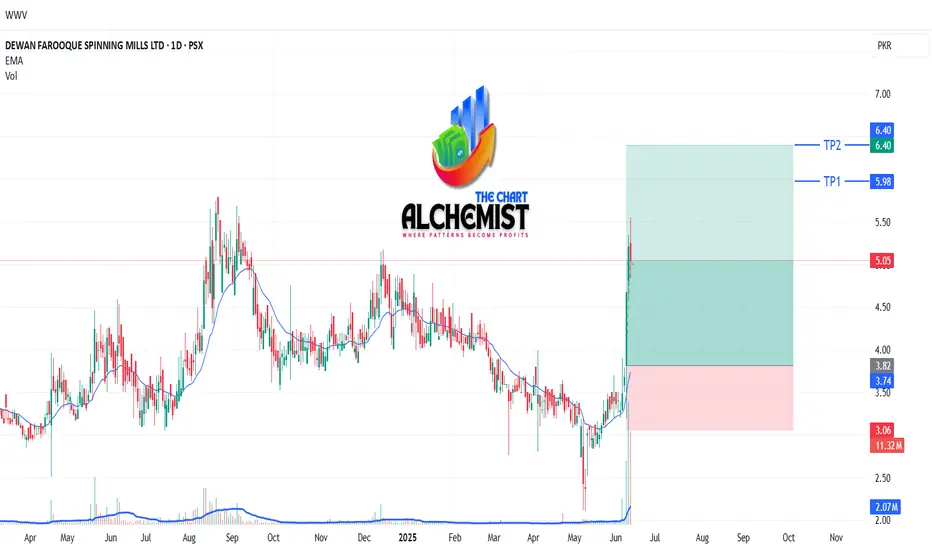
DFSM UNORTHODOX LONG TRADE (FOR ADVANCED TRADERS ONLY)15-06-2025DFSM Unorthodox Long Trade 15-06-2025 (FOR ADVANCED TRADERS ONLY)
Rationale: DFSM has recently shown a change of character from downtrend to uptrend and is currently in a spike phase. Given the momentum, an unorthodox buy call for advanced traders seems profitable.
🚨 TECHNICAL BUY CALL – DFSM🚨
Buying Strategy
- *Buy at Current Price*: Rs. 5.05
- *Additional Buying*: Buy on close of every day candle until it reaches Rs. 3.8 or crosses Rs. 5.6
- *TP 1*: Rs. 6.00
- *TP 2*: Rs. 6.4
*Stop Loss*: Below the lowest buying level
This unorthodox call is suited for advanced traders comfortable with accumulating positions based on daily candle closes and managing risk accordingly.
Caution: Please buy on levels in 3 parts. Close at least 50% position size at TP1 and then trail SL to avoid losing incurred profits in case of unforeseen market conditions.
BUXL LONG TRADE/INVESTMENT CALL (SECOND STRIKE) 15-06-2025BUXL – Buy Call on 1W Time Frame (Second Strike) 15-06-2025
Past Price Action:
Since its listing on PSX in February 2013, BUXL has maintained a steady long-term uptrend. After a correction, the stock surged in June 2021, reaching Rs. 485. Following another pullback, it entered a weekly accumulation phase from December 2022.
BUXL Recent Price Action:
BUXL broke out of this consolidation with strong volume momentum, signaling renewed bullish potential. A bull flag formation was observed, with a peak at Rs. 216 before retracement.
✅ Our earlier call’s first target of Rs. 184 has been successfully achieved.
🚨 TECHNICAL BUY CALL – BUXL🚨
- Buy 1: Rs. 185 (CP)
- Buy 2: Around Rs. 150
- Buy 3: Rs. 124
- TP 1: Rs. 240
- TP 2: Rs. 284
- Long-term TP 1: Rs. 361
- Long-term TP 2: Rs. 427
- Long-term TP 3: Rs. 484 (previous all-time high)
- Extended Target: Rs. 584 (calculated through Fibonacci ratio extension)
- Stop Loss: Below Rs. 80
- Risk-Reward Ratio: 7.6
Caution: Please buy on levels in 3 parts. Close at least 50% position size at TP1 and then trail SL to avoid losing incurred profits in case of unforeseen market conditions.

important to Sustain 183-184.BUXL Closed at 183.11 (13-06-2025)
Bullish on All Time Frames.
Crossing 222 with Good Volumes may
result in further upside with Targets
around 350+
However, important to Sustain 183-184.

Beautiful ABCD pattern appearing on bigger tf.Beautiful ABCD pattern appearing on
bigger tf.
Crossing 101 - 102 with Good Volumes may
trigger new highs towards 120 atleast.
78 - 80 is an Immediate Resistance area.
On the flip side, a Very Strong Support is
around 68 - 70 & then around 62 - 63

Bullish on All Time Frames.GHGL Closed at 39.61 (13-06-2025)
Bullish on All Time Frames.
Important Support Level seems
to be around 39 & then 34 - 36.
Breaking 33 may result in further
selling pressure.

DCL LONG TRADE (SECOND STRIKE) 14-06-2025DCL LONG TRADE -Second Strike
DCL recently broke out from a Cup and Handle pattern with supportive volume analytics, confirming the strength of the uptrend. Given the stock's rapid appreciation phase in the newly formed uptrend, we identify another opportunity for re-entry. The stock has formed a bullish IFDZ and several bullish imbalances, suggesting the possibility of a second strike and further gains.
🚨 TECHNICAL BUY CALL – DCL🚨
- Buy 1: Rs. 14.49 (current level)
- Buy 2: Rs. 14.15
- Buy 3: Around Rs. 13.2
- TP 1: Rs. 16.5
- TP 2: Rs. 17.5
- TP 3: Rs. 19.4
- Long-term TP 1: Rs. 20.75
- Long-term TP 2: Rs. 22.1
- *Stop Loss*: Below Rs. 12 (Day Closing)
- *Risk-Reward Ratio*: 4.2
Caution: Please buy on levels in 3 parts. Close at least 50% position size at TP1 and then trail SL to avoid losing incurred profits in case of unforeseen market conditions.

NICL LONG TRADE 14-06-2025NICL LONG TRADE
NICL has been trading in an uptrend channel (light blue) and recently broke out from a range (yellow channel) at around Rs. 155 after a positive change of character. The stock is currently in another trading range (darker blue channel). Volume dynamics and analytics, along with gradual price action variation, suggest an upcoming uptrend. The stock is expected to achieve at least minimum quantified displacement targets as shown below.
🚨 TECHNICAL BUY CALL – NICL🚨
- Buy 1: Rs. 158.3 (current level)
- Buy 2: Rs. 153.3
- Buy 3: Rs. 150.4
- TP 1: Rs. 170
- TP 2: Rs. 180
- *Stop Loss*: Below Rs. 144 Day Closing
- *Risk-Reward Ratio*: 3.1
Caution: Please buy on levels in 3 parts. Close at least 50% position size at TP1 and then trail SL to avoid losing incurred profits in case of unforeseen market conditions.

GCIL LONG TRADE (SECOND STRIKE) 14-06-2025GCIL LONG TRADE - Second Strike (1-Hour Timeframe)
After achieving previous targets, GCIL presents an opportunity for further gains. The stock's movement has been in a stair-step uptrend pattern, mostly contained within an uptrend channel (light blue). Recently, the stock has formed another stair-step pattern and appears primed for an upward thrust from a recently formed order block.
🚨 TECHNICAL BUY CALL – GCIL🚨
- Buy 1: Rs. 20.15 (current price)
- Buy 2: Rs. 19.65
- Buy 3: Rs. 18.7
- TP 1: Rs. 21.7
- TP 2: Rs. 22.8
- TP 3: Rs. 23.99
- *Stop Loss*: Below Rs. 18.1 day Closing
- *Risk-Reward Ratio*: 2.62
Caution: Please buy on levels in 3 parts. Close at least 50% position size at TP1 and then trail SL to avoid losing incurred profits in case of unforeseen market conditions.

GATM LONG TRADE (SECOND STRIKE) 14-06-2025GATM LONG TRADE- Second Strike (1-Hour Timeframe)
GATM previously achieved partial targets after our buy call. The stock has formed a bullish mitigation block, a consolidation channel, and a spring below this channel, indicating potential for continuation of the uptrend. Volume gradient support further confirms the assumption of an uptrend. Targets have been calculated using the Quantified Displacement method.
🚨 TECHNICAL BUY CALL – GATM🚨
- Buy 1: Rs. 23.95 (current price)
- Buy 2: Rs. 23.35
- Buy 3: Rs. 22.8
- TP 1: Rs. 25.8
- TP 2: Rs. 28
- TP 3: Rs. 29.6
- *Stop Loss*: Below Rs. 21.8 on Day Closing
- *Risk-Reward Ratio*: 3.2
Caution: Please buy on levels in 3 parts. Close at least 50% position size at TP1 and then trail SL to avoid losing incurred profits in case of unforeseen market conditions.

DFML LONG TRADE 14-06-2025DFML LONG TRADE 14-06-2025
DFML previously formed a double top pattern, which is typically bearish, but it appears to have failed. Recently, the stock reversed from a low of Rs. 25.6 in a spike pattern, consolidated, and then resumed its upward leg.
Currently, DFML has formed:
- A powerful bullish imbalance
- A bullish mitigation block
- Two bullish price imbalances
The recent consolidation (since May 15) formed a bearish wedge (bull flag) with three down pushes, which has now broken out to the bullish side.
🚨 TECHNICAL BUY CALL – DFML🚨
- Buy 1: Rs. 39.48 (current price)
- Buy 2: Rs. 38.4
- Buy 3: Rs. 37.2
- TP 1: Rs. 41.69
- TP 2: Rs. 44.4
- TP 3: Rs. 47.8
- *Stop Loss*: Below Rs. 34.4 closing basis
- *Risk-Reward Ratio*: 3.8
Caution: Please buy on levels in 3 parts. Close at least 50% position size at TP1 and then trail SL to avoid losing incurred profits in case of unforeseen market conditions.

DFML LONG TRADE 14-05-2025DFML LONG TRADE
DFML previously formed a double top pattern, which is typically bearish, but it appears to have failed. Recently, the stock reversed from a low of Rs. 25.6 in a spike pattern, consolidated, and then resumed its upward leg.
Currently, DFML has formed:
- A powerful bullish imbalance
- A bullish mitigation block
- Two bullish price imbalances
The recent consolidation (since May 15) formed a bearish wedge (bull flag) with three down pushes, which has now broken out to the bullish side.
🚨 TECHNICAL BUY CALL – DFML🚨
- Buy 1: Rs. 39.48 (current price)
- Buy 2: Rs. 38.4
- Buy 3: Rs. 37.2
- TP 1: Rs. 41.69
- TP 2: Rs. 44.4
- TP 3: Rs. 47.8
- *Stop Loss*: Below Rs. 34.4 closing basis
- *Risk-Reward Ratio*: 3.8
Caution: Please buy on levels in 3 parts. Close at least 50% position size at TP1 and then trail SL to avoid losing incurred profits in case of unforeseen market conditions.

NCL LONG TRADE 14-06-2025NCL LONG TRADE
NCL has been in a long-term uptrend, marked by a yellow channel. After touching the bottom of the channel, the stock is currently in an up leg within the channel, further bound by a light blue channel. A mitigation block and price imbalance offer a potential entry opportunity.
🚨 TECHNICAL BUY CALL – NCL🚨
- *Buy 1*: Rs. 37.6 (current level)
- *Buy 2*: Rs. 36.3
- *Buy 3*: Rs. 34.7
- *TP 1*: Rs. 40.1
- *TP 2*: Rs. 42.1
- *TP 3*: Rs. 46.6
- *Stop Loss*: Below Rs. 32.5
- *Risk-Reward Ratio*: 3.1
Caution: Please buy on levels in 3 parts. Close at least 50% position size at TP1 and then trail SL to avoid losing incurred profits in case of unforeseen market conditions.

ENGROH LONG TRADE (SECOND STRIKE) 14-06-2025ENGROH Technical Buy Call -Second Strike
ENGROH previously marked a high of Rs. 287, followed by a bearish spike and channel, reaching a support line around Rs. 138. The downward channel ended with a selling climax, and the stock reversed upwards in a sharp spike with drastic volumetric imbalance. Currently, the stock is trading around Rs. 180.
🚨 TECHNICAL BUY CALL – ENGROH🚨
- *Buy 1*: Rs. 178 (current level)
- *Buy 2*: Rs. 170
- *Buy 3*: Rs. 160
- *TP 1*: Rs. 196
- *TP 2*: Rs. 219
- *TP 3*: Rs. 230
- *TP 4*: Rs. 240
- *Stop Loss*: Below Rs. 159
- *Risk-Reward Ratio*: 1:3.3
Caution: Please buy on levels in 3 parts. Close at least 50% position size at TP1 and then trail SL to avoid losing incurred profits in case of unforeseen market conditions.

ANL LONG TRADE (SECOND STRIKE) 14-06-2025ANL Second Strike (1H TF)
ANL has been in an accumulation zone (blue channel) and recently touched the top at Rs. 9.6 in December 2024. After a down leg (pink channel) with a selling climax and false breakdown, the stock reversed upwards. Having achieved previous targets, ANL is nearing completion of its pullback, making it a potential entry point for a second strike long trade near 1-hour IFDZ.
🚨 TECHNICAL BUY CALL – ANL🚨
- Buy 1: Rs. 8.0
- Buy 2: Rs. 7.9
- Buy 3: Rs. 7.7
- TP 1: Rs. 8.31
- TP 2: Rs. 8.99
- TP 3: Rs. 9.8
- *Stop Loss*: Below Rs. 7.4
- *Risk-Reward Ratio*: 1: 3.94
Caution: Please buy on levels in 3 parts. Close at least 50% position size at TP1 and then trail SL to avoid losing incurred profits in case of unforeseen market conditions.

BFAGRO LONG TRADE - 1H TF 14-06-2025BFAGRO High Probability Buy Trade Setup (1-H TF)
BFAGRO recently broke out from a converging channel, which had been trending upwards since reversing from a down leg after its PSX inception in March 2025. The validity of this breakout is supported by:
- Volume analytics
- Creation of a bullish mitigation block
- A bullish order block
- A bullish measuring gap
These formations indicate a genuine shift towards a bullish trend.
🚨 TECHNICAL BUY CALL – BFAGRO🚨
- Buy 1: Rs. 30.00 (current level)
- Buy 2: Rs. 29.60
- Buy 3: Rs. 29.00
- TP 1: Rs. 31.6
- TP 2: Rs. 33.00
- TP 3: Rs. 35.1
- TP 4: Rs. 36.6
- TP 5: Rs. 37.9
- *Stop Loss*: Below Rs. 27.5 CLOSING BASIS
*Risk-Reward Ratio*: 4.3
Caution: Please buy on levels in 3 parts. Close at least 50% position size at TP1 and then trail SL to avoid losing incurred profits in case of unforeseen market conditions.

BIPL LONG TRADE SECOND STRIKE 13-06-2025BIPL LONG TRADE
Previous Price Action
BIPL has recently broken out of its re-accumulation zone, which began in February last year. The stock has demonstrated high momentum with a bullish IFDZ and a bullish measuring gap, indicating a strong uptrend. This setup uses the quantified displacement method to calculate targets, indicating a high potential for continuation of the uptrend.
🚨 TECHNICAL BUY CALL – BIPL🚨
- *Buy 1*: Rs. 28.0 (current level)
- *Buy 2*: Rs. 27.2
- *Buy 3*: Rs. 26.0
- *Buy 4*: Rs. 25.5
- *TP 1*: Rs. 29.8
- *TP 2*: Rs. 32.0
- *TP 3*: Rs. 34.0
- *TP 4*: Rs. 35.8
Stop Loss
- *Stop Loss*: Below Rs. 22.9
Risk-Reward Ratio
- *Risk-Reward Ratio*: 3.11
Caution: Please buy on levels in 3 parts. Close at least 50% position size at TP1 and then trail SL to avoid losing incurred profits in case of unforeseen market conditions.

ASHT UNORTHODX LONG TRADE (ADVANCED TRADERS ONLY) 13-06-2025ASHT UNORTHODOX LONG - SECOND STRIKE
This is an excellent high-probability setup for intermediate to advanced traders. ASHT has started a new bullish trend after accumulation in a scale-up scallop and channel pattern, which when combined, resemble a cup and handle pattern.
🚨 TECHNICAL BUY CALL – ASHT🚨
- *Buy 1*: Rs. 25.7 (current level)
- *Buy 2*: Continue buying up to Rs. 28.55 or on pullback at Rs. 21.5
- *Buy 3*: Rs. 18.9
Target Prices
- *TP 1*: Rs. 28.55
- *TP 2*: Rs. 31.75
- *TP 3*: Rs. 35.0
Stop Loss
- *Stock Loss*: Below Rs. 15.6
This setup uses the quantified displacement method with a scaling-in and scaling-out approach. FOR ADVANCED TRADERS ONLY

WTL LONG TRADE 13-06-2025WTL LONG TRADE
- WTL completed its uptrend in mid-December 2024, followed by a distribution phase and a breakdown in January 2025, marking a low of Rs. 1.05.
- The stock showed an upward reversal supported by price action and volume gradient, creating a bullish order block, IFDZ, and FVG.
- These bullish barriers make the current location a good place for a new entry or averaging in old stock trades.
🚨 TECHNICAL BUY CALL – WTL🚨
- *Buy 1*: Rs. 1.46 (current level)
- *Buy 2*: Rs. 1.40
- *Buy 3*: Rs. 1.36
Target Prices
- *TP 1*: Rs. 1.59
- *TP 2*: Rs. 1.72
- *TP 3*: Rs. 1.86
Trade Validity
- *Stop Loss*: Below Rs. 1.24 on a daily closing basis
- *Reward-to-Risk Ratio*: 3.85
Disclaimer: We don't recommend trading in Penny Stocks below Rs 5.00

HIRAT LONG TRADE 13-06-2025HIRAT LONG TRADE
- The stock was in an uptrend until the first week of September 2024, followed by a complex correction in a converging channel (marked with dotted lines).
- After the accumulation phase, the stock experienced a sharp downward move in a liquidity sweep and then reversed upwards with massive volume gradient, forming a scallop pattern.
- The stock then entered a channel trading range, creating a bullish IFDZ and a bullish measuring gap, indicating potential for an upward move.
🚨 TECHNICAL BUY CALL – HIRAT🚨
- BY1: 3.98 (current level)
- BY2: 3.86
- BY3: 3.68
- Targets calculated using the Quantified Displacement Method:
- TP1: 4.45
- TP2: 5.15
- TP3: 5.80
- Stop loss: below 3.20
- Reward-to-risk ratio: 4.5
Caution: Please buy on levels in 3 parts. Close at least 50% position size at TP1 and then trail SL to avoid losing incurred profits in case of unforeseen market conditions.

BAPL LONG TRADE 13-06-2025BAPL LONG TRADE
- BAPL was previously in an accumulation zone from December 2020 to May 2024, marked in yellow.
- The stock gave a huge breakout in May last year and continued in an upward channel, marked in blue.
- After touching the bottom of the new channel in early April, the stock started ascending with vigorous volume distribution.
- BAPL created a bullish IFDZ and reached a high of Rs. 60.5 before pulling back to the IFDZ with suitable volume contraction and then expanded volume, indicating a potential long entry.
🚨 TECHNICAL BUY CALL – BAPL🚨
- BY1: Rs. 44.25 (current price)
- BY2: Rs. 40.5
- BY3: Rs. 38.9
Target Prices
- TP1: Rs. 49.9
- TP2: Rs. 57.9
- TP3: Rs. 65.1
Trade Validity
- Stop loss: below Rs. 36.7
- Reward-to-risk ratio: 5.4
Caution: Please buy on levels in 3 parts. Close at least 50% position size at TP1 and then trail SL to avoid losing incurred profits in case of unforeseen market conditions.

BIPL LONG TRADE 05-06-2025BIPL has been trading in a channel since March 2024, with a range of PKR 20 to PKR 26.1. Recently, the stock made a sharp downward move in the form of a spring, quickly returning within the range, indicating a potential reversal or upward action.
The stock has formed a reversal pattern in the shape of an inverted head and shoulders pattern, with adequate volume distribution and price action in a spike fashion, suggesting an upward move is likely.
However, buying at the current level of PKR 23.15 is not recommended. Instead, we suggest waiting for a pullback to the demand zone that caused the upward move, which lies between PKR 22.3 and PKR 21.4.
🚨 TECHNICAL BUY CALL – BIPL🚨
- Buy 1: PKR 22.3
- Buy 2: PKR 21.4
TP1: PKR 24.7
TP2: PKR 26
stop Loss: Below PKR 20 (DAILY closing)
Risk-Reward Ratio: 1:3.37
