Play on Levelsas discussed in Yesterday's Video, 720
is the resistance level. it resisted exactly from
this level.
Now Support lies around 700 - 702 & then
around 677 - 679
If 725 is Crossed with Good Volumes, we may witness
800.

Weekly CLosing is ImportantWeekly Closing above 26.70 would be
very positive. However, 29 - 29.20 is
the Immediate Resistance Level.

CPHL Stock Trading Strategy:CPHL has posted a breakout and is currently trading at 98. The strategy is to buy around 98-94, set a stop loss at 90, and target a price of 108.

PSX – 30-Min Long Trade Setup !📈 🟢
🔹 Asset: Pakistan Stock Exchange Ltd. (PSX – PSX)
🔹 Timeframe: 30-Min Chart
🔹 Setup Type: Trendline Breakout + Retest
📊 Trade Plan – Long Bias
✅ Entry Zone: Around 23.39 (post-breakout confirmation)
✅ Stop-Loss (SL): 22.85 (below recent structure low)
🎯 Take Profit Targets:
📌 TP1: 24.52 – Previous resistance
📌 TP2: 25.98 – Major supply / top of the range
📐 Risk-Reward Calculation
🟥 Risk: 23.39 - 22.85 = 0.54 PKR/share
🟩 Reward to TP2: 25.98 - 23.39 = 2.59 PKR/share
📊 R/R Ratio: ~1 : 4.79 – Excellent opportunity
🔍 Technical Highlights
📌 Falling trendline broken with bullish momentum ✔
📌 Support holding at 22.85 (white line) ✔
📌 Volume spike + bullish retest confirmation 🔥
📌 Yellow zone = structure resistance turned support
📉 Risk Management Strategy
🔁 SL to breakeven after TP1
💰 Book partial at TP1
🚀 Let the rest run to TP2
📏 Use structure – not emotion
⚠️ Setup Invalidation If:
❌ Breaks and closes below 22.85
❌ Fakeout candle with volume and rejection
❌ Loses trendline and support zone
🚨 Final Thoughts
✔ Trendline breakout confirmed with strong R/R
✔ Clean structure for intra or swing setups
✔ Great setup for PSX-focused traders
🔗 #PSX #PakistanStockExchange #TechnicalSetup #ProfittoPath #BreakoutTrade #RiskReward #StockTrading #SupportResistance #ChartAnalysis


Cup & Handle Formation in process but..Cup & Handle Formation in process but Yes, there is a Bearish Divergence
on Weekly Tf.
Resisted exactly from the mentioned level around 116-117.
Could not Sustain this level.
Now Weekly Closing above 104 - 105 is important.
Next Support lies around 96 - 97
If 118 is Crossed & Sustained, we may Target around 145 - 146.

MARI - ProjectionsProjections 1000+ PKR
AB = CD
MARI made a correction at 0.618 Fib, of Last AB Wave.

Power cement may double its valuePower cement may cross 20 and 25 level. Currently on 12. Note: this is not a buy sell call. Trade at your own will and use stop loss.

Flying cement is still in bullish zone Flying cement is still in bullish zone and may cross level of 29 again. This is not a buy sell call. Use stop loss too.

DGKC Trading Analysis:DGKC broke down after consolidating between 32-36 and is now trading at 124. The strategy is to exit if the price shows weakness when it revisits the 30-level mark.
Downside Targets:
1. *First target*: 110
2. *Second target*: 102
This analysis suggests a cautious approach, with a focus on managing risk and potential downside targets.

SYS buying Opertunity Buy Recommendation: Accumulate on weakness below 530-515.
Risk Management: Set stop loss at 507.
Target Price Range: 580-617.
This strategy suggests buying SYS stock on dips, managing risk with a stop loss, and aiming for higher targets.

FFCFFC has been consolidating within a symmetrical triangle pattern after a strong bullish rally
Volume: Slightly declining during consolidation
Safe entry zone is marked


POL PROBABLY IN WAVE 'C' OR 'A' This is an update on our POL wave count shared earlier, we have modified the wave count looking at the formations.
If the wave count is correct then we are in an ending diagonal which is either complete or in the last leg of completion, we will buy once price breaks above 575.
Alternate count is that of 5th wave will get extended downwards, however that probability is low that is why we have removed our short sell trading setup.
Although possibility of the downside is still there, the formation of double top chart pattern and our weekly crude oil wave count does support downside long term.
There's a correlation between international crude oil prices and Oil & Gas exploration sectors, however currently the markets have not been correlating much but on the long run prices will tend to correlate.
Let see how this plays, Good Luck !
Disclaimer: The information presented in this wave analysis is intended solely for educational and informational purposes. It does not constitute financial or trading advice, nor should it be interpreted as a recommendation to buy or sell any securities.

Weekly Closing not bad!Weekly closing not bad.
105-106 should be crossed with
Good Volumes targeting 110-113

Weekly Closing not Good but..Weekly Closing not Good but
the Stock is Still Bullish on Bigger
Time Frames.
Price dropped with Low Volumes.
Weekly Important Support seems to
be around 42.50 - 44.10
49-50 is an Important Resistance as
of now.

Play wisely!Currently at an Important Support level.
Bullish Divergence on Daily Tf.
Currently also at Channel Bottom.
Couple of Bullish Candles will confirm that
Channel Bottom is respected.

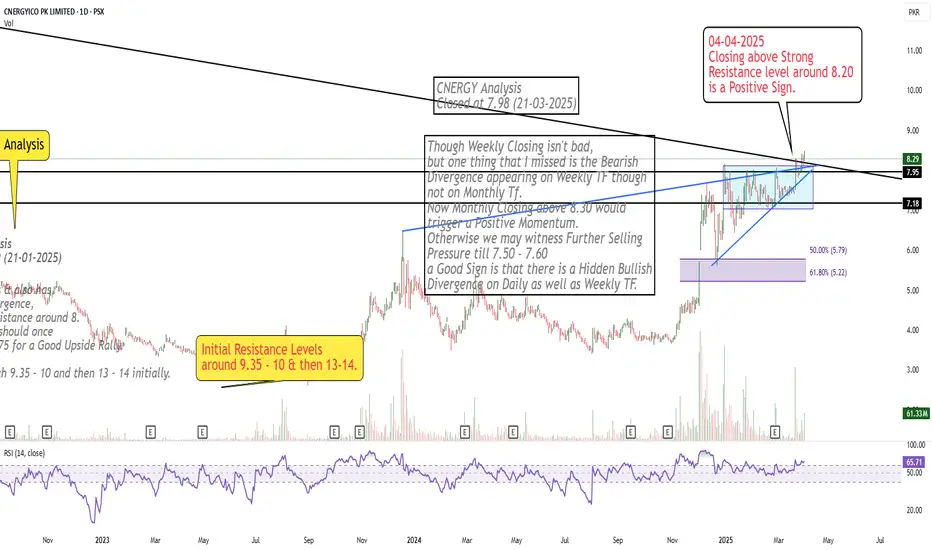
Crossed Important Resistance Area
Closing above Strong
Resistance level around 8.20
is a Positive Sign.
Haleon is in bullish zone Haleon is in bullish zone and may cross 820 and 850 level. This is not a buy sell trade call. Use stop loss.

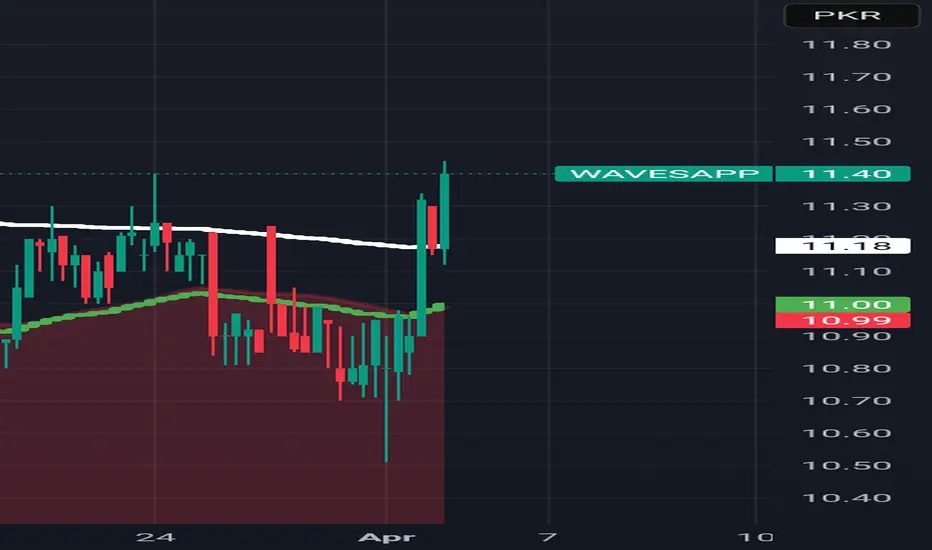
Wavesapp is in bullish zoneWavesapp is now in bullish zone and may be it cross 12 and 13 level soon.
Note: This is not a buy sell call. Use stop poss whenever trade.