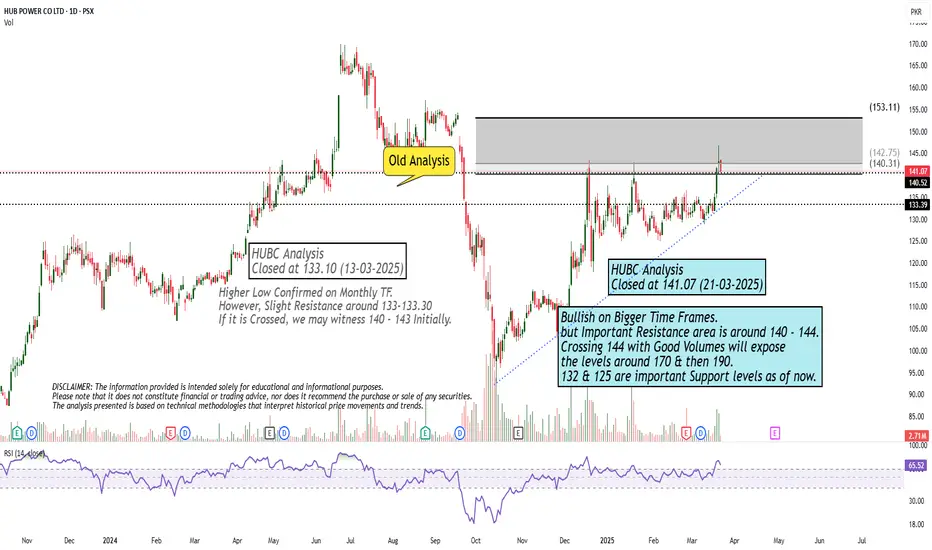
Bullish on Bigger Time Frames.Bullish on Bigger Time Frames.
but Important Resistance area is around 140 - 144.
Crossing 144 with Good Volumes will expose
the levels around 170 & then 190.
132 & 125 are important Support levels as of now.
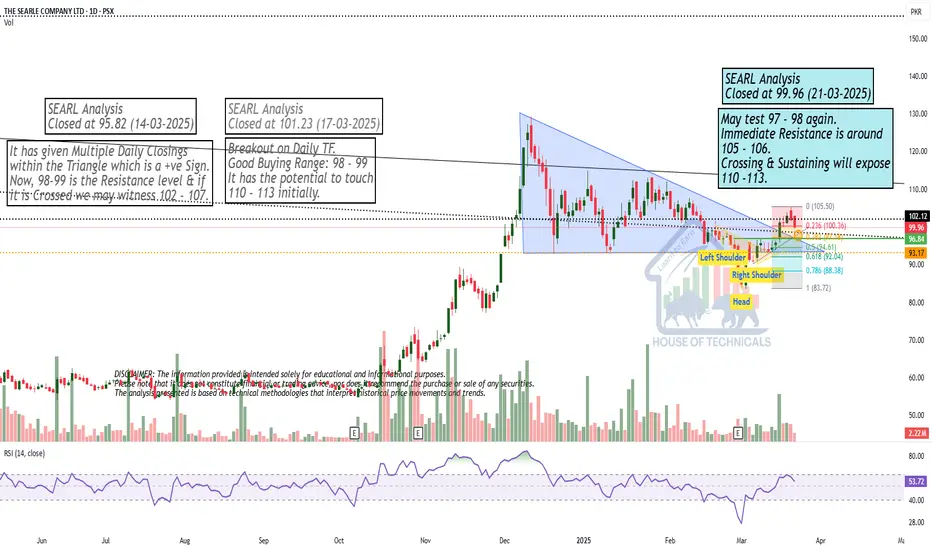
May test 97 - 98 again.May test 97 - 98 again.
Immediate Resistance is around
105 - 106.
Crossing & Sustaining will expose
110 -113.
Monthly TF:
Cup & Handle Formation on Bigger TF.
Strong Support is around 263 - 265
Monthly Closing above 312 - 313 would be
a positive trigger.
Upside Target can be around 400 - 405
once 360 - 365 is Crossed & Sustained.
Ultimate Target can be around 640 - 650
from Short to Medium Term.
However, it should not break 240 otherwise
we may expect Huge Selling Pressure.

Bullish on Bigger Time Frames.Bullish on Bigger Time Frames.
Immediate Resistance is around 126 - 127.
Potential to touch 200 is 127 is Sustain on
Monthly Basis.
On the flip side, 101 - 111 is the Support level
(if it takes pressure now.
Now it should not Break 89.

Breakout ExpectedMonthly Closing above 18.40 will trigger
further upside.
Long Consolidation Breakout Expected.
Bullish on Weekly TF.
Hidden Bullish Divergence on Weekly TF.

Monthly Closing above 169 - 170 is Important.Immediate Support is around 160 - 164
and in worst case, we may witness 148 -152.
as mentioned earlier, 164 - 169 is an Important
Resistance area that needs to Sustain.
Now monthly Closing above 170 would be a positive sign.

Still BullishRetested the Previous Breakout Level
around 37 - 38.
Immediate Support is around 46 - 46.50 now.
Monthly Closing above 48.20 would be
very healthy sign; targeting around 55.
& then around 60.

Play on LevelsMonthly Support is around 640 - 674.
Monthly Resistance is around 702.
Closing above this level may expose
levels around 750 - 755 & then around 780.
This time breaking 620 will bring more
Selling pressure towards 575-578.
Bullish on Weekly & Monthly TF.

Weekly Closing just at Resistance!Weekly Closing just around Resistance
level (580), so a slight pressure may be seen, unless it
Sustains 580. If this be the case, 545 - 565 can be witnessed.
Bullish on Weekly TF & a perfect
Morning Star Formation on Weekly Tf.
Also, it has retested the previous breakout level
around 520.
Now it should Cross & Sustain 605-606 to continue
its Bullish Momentum & immediate targets can be around
650 - 655.
On the safe side, 596 - 621 Zone is a Resistance zone.

Bearish Divergence has started appearing but...Bearish Divergence has started appearing
on Weekly TF but not yet on Monthly, so
a pressure might be seen around 116 - 117.
& Sustaining this level will expose 135 - 138 targets.
On the flip side, 101 - 109 may act as a Good
Support zone in case of pressure.

CPHL Buying setupHere is the corrected text:
"CpHL is currently trading in the buying zone. We can buy:
1. Around 87-83
2. Second buy when price crosses or closes above 93
Stop Loss: 81
Target: 108
Further hold if closes above 108."

CPHL BUYING SETUPHere is the corrected text:
"CpHL is currently trading in the buying zone. We can buy:
1. Around 87-83
2. Second buy when price crosses or closes above 93
Stop Loss: 81
Target: 108
Further hold if closes above 108."

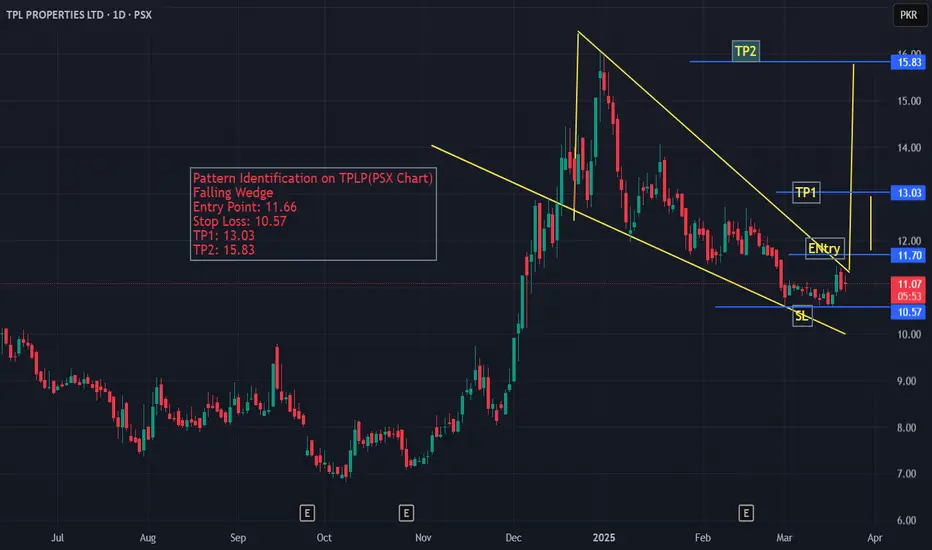
Chart Identification on TPLP(PSX) Daily ChartThe Chart of TPLP shows a pattern of Falling Wedge, The projections for this stock and the entry point, stop loss and TP1 and TP2 are mentioned on the chart for traders and ivestors.
PRL WEEKLY CHART TOWARDS 60 ??PSX:PRL
1. Weekly chart suggests that price is working in cup shape.
2. AB:CD pattern is in play since 2023.
3. DEC23 : 35, Dec24: 45
4. Safe bet for PRL with current patterns is 55-60

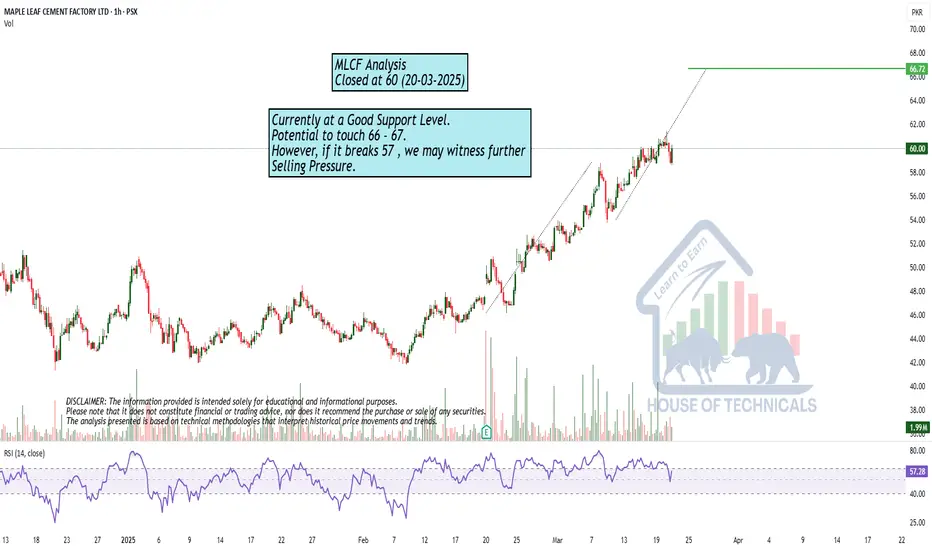
at Important Support LevelCurrently at a Good Support Level.
Potential to touch 66 - 67.
However, if it breaks 57 , we may witness further
Selling Pressure.
KEL is heading to 5KEL technically enters in bullish trend and it is expected to cross 5 level.
Note: this is not a buy sell call. Use SL too.

BBFL is heading to 55BBFL is in bullish zone and it is expected to cross 55 level
Note. This is not a buy sell call use stop loss.

Sys is heading to 600+Sys is in bullish trend and it is technically in strong bullish trend and it is expected to cross 600 and 620 level
Note. This is not a buy sell call and use stop loss too.

Efert could drop to 200 to 188Technically efert is dropping its support level and it is expected to more drop to 200 and 188 level
Note; This is not a buy sell call, use stop loss too.

Re-Testing of Breakout Level around 520.Re-Testing of Breakout Level around 520.
If Weekly Candle Closes above 520 - 521, we may
expect an Upside towards 550.
Also there is Bullish Divergence so we may
expect that it will play this time & push the price upside.
On the flip side, 500 - 504 is the Channel Bottom.
and Remember, Once 650 is Crossed with Good Volumes,
it may expose New Highs targeting around 700.

PRL is at a buy pricePRL is at a buy price and ready to shoot. Taking support from it's trend line and accumulation phase is almost over.

HCAR - LongThe auto sector as a whole has seen movement, but HCAR has yet to perform, primarily due to the lack of new product launches, making it less competitive against peers. However, sales for the January–March quarter have shown a significant increase , which is expected to reflect positively in profitability.
From a technical perspective, the stock needs to close above 312 with a strong green candle to gain momentum. All target levels are marked on the chart.
Please conduct your own research before making any investment decisions.

RPL - LongLooking good as the weekly trendline is broken. In a bullish market, this share needs to catch up so I am giving this long call based on market psychology. Do your own research
TP 1: 21.2
TP2: 22.3
Tp 3: 24
