PAEL - THE BEST SETUPPAEL has always been my favorite stock as it plays very well on price action and technical.
Right now the trending accumulation has ended and its time for a move.
if we take the simple and basic previous demand copy. It gives the target of 60 which everyone is expecting. but there might be some trick played to take out the retails. so be careful around 55 and 59 level you might see the trend slowdown in short term due to divergence on RSI.
right now if you want to accumulate more wait for the intraday retest levels around 46 to 44.
I HAVE ALREADY ENTERED THIS SETUP AROUND 43.
THE TAKE PROFIT IS 55 AND THEN 58 TO 59 ACCORDINGLY.

WTL Stock Ready for a Bounce? Levels to Watch in Mar & AprMarket Outlook :
The stock has been in a downtrend, trading within a descending channel. It has been forming lower highs and lower lows, indicating bearish momentum. Currently, the price is near the lower boundary of the channel, which might act as a support level.
Trading Strategy
1.28 - 1.30 PKR (First Buy Zone/temporary support)
1.20 - 1.22 PKR (Strong preferable buy zone)

Govt. to Clear HUBCO’s Pending Payments Within 90 DaysBullish Breakout: Price has cleared a key resistance zone at 144-46 PKR, signaling an upward trend.
Buying Momentum: As long as the price stays above the trendline, the bullish trend remains intact.
Overbought : Currently stock at Overbought zone, A short-term pullback and consolidation is due before another rally.


Unity Foods at top of the channel in May25 ??PSX:UNITY
Weekly upward channel suggests that;
1. when it hits channel bottom and forms a bullish candle,
2. it needs 8-9 weeks for upside move and hits channel top,
3. this time, it is coming around 42+ or 48% gain from CMP.


Treet PSXPattern,
Volums,
stop-loss defined,
Assume the Corrective phase completed,
Entry on break of Lower high,


Trading in a Parallel Channel on Monthly TF.Trading in a Parallel Channel on Monthly TF.
Strong Support around 49 - 50 & then 54.
However, 53.20 if SUstained on Weekly
basis, may give further upside around 57 - 58
To be in Uptrend, it should cross 61 - 62. &
Don't Forget the Channel Top is around 75 - 77
On the flip side, 46 is the last level that should
not break.

BULLISH FLAG PATTERN FOR THE PAEL LOVERS The script of PAEL looks in a good shape and forming bullish flag pattern. The price has triggered the breakout and now it seems it will touch the Rs. 60 mark soon.
The share is also fundamentally very strong and in the favorable time of the year to ride the trend.

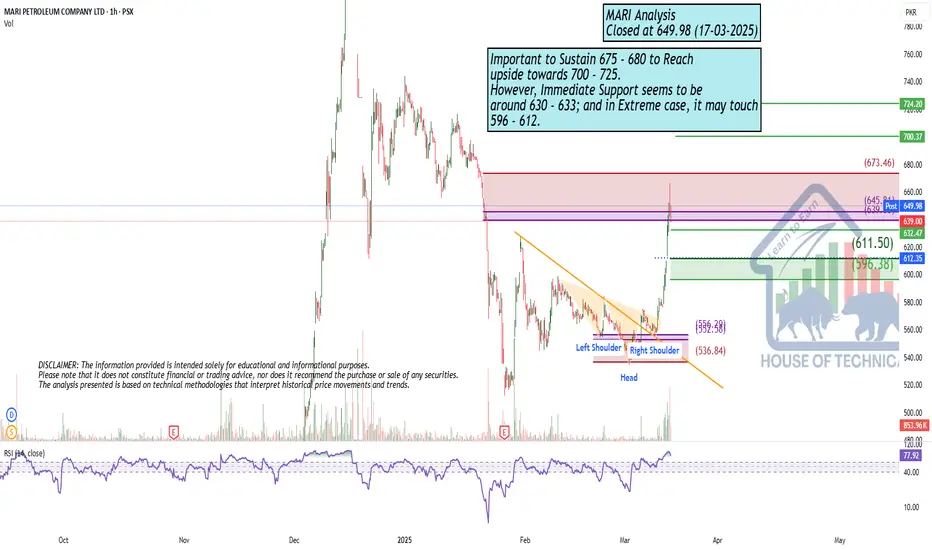
Still BullishImportant to Sustain 675 - 680 to Reach
upside towards 700 - 725.
However, Immediate Support seems to be
around 630 - 633; and in Extreme case, it may touch
596 - 612.
Earnings, Trendlines, & Cyclic Momentum: PAEL at a Turning PointPre :
PAEL has shown strong financial growth, with Q1 2024 net profit surging 1,090% YoY to PKR 444.9 million, driven by eased import restrictions and market stability. For the nine months ending September 2024, profit after tax rose 97% YoY to PKR 1.863 billion, supported by a 35% revenue increase due to higher sales volumes and price adjustments.
Post :
the stock is trading in rising wedge pattern with support levels at PKR 43.58 and 40.50 and RSI indicates near overbought levels, potential short-term volatility. Main future outlook depends on government upcoming energy policies, increasing home solar systems market demand will intact,
Key on eyes upon 46-levels breaks above levels rally towards 54-58 PKR, aligning with the projected 15-20% gain.

Ambitious SEARL Trade BuySearl is moving in descending manner and can be seen as a bullish pattern. Can see Buy=around 77.12 with a SL =76.5 and TP =125
Ambitious, but possible!

Bullish on Bigger TFImmediate Support is around 605 - 610
else, around 590 - 591
2 Possibilities:
1. If reverses from the current level, it may
touch 690 - 730 range.
2. If it does not sustain 590, it should come
down towards 570 ~ 555 range.
Weekly Support 558 should not break as this is
also the HL.

Hidden Bullish Divergence appeared.Hidden Bullish Divergence appeared.
Breaking Out a long Consolidation Box around
145 - 149.
164 - 169 is a Strong Resistance zone.
If this Level is Sustained, we may witness
200+
However, if 135 - 136 is broken, more Selling
Pressure will be witness & it may drag the price
towards 113 - 115.

Good Trade SetupIt has taken a Support from
a Very Strong Level around 90 - 94.
Immediate Resistance is around 110 - 113
Day / Swing Traders may enjoy 5 - 7 rupees profit.
Good Support level is around 102.50 - 104.50
The Stock has the potential to reach upto 120 - 130
& if this level is Crossed with Good Volumes,
Next Target can be around 150+
96 is an Important level that should not break now.

PIBTL Price Forecast: Buy the Breakout or Wait for a Pullback?Current Price: PKR 9.71
Trading Strategy:
Entry Point: If the stock successfully breaks above the trendline (~PKR 10.00) with strong volume, enter a buy position.
Target Price: First target PKR 12.50, second target PKR 14.00.
Stop-Loss: Below the recent swing low (~PKR 8.50) to limit downside risk.

Mari-Nears Key Support – Potential Rebound Ahead?" ANSWER : YES
The price is approaching this trendline support, indicating a potential upward trend over time.

Bearish Divergence on Weekly TF but... there is a Breakout..Bearish Divergence on Weekly TF.
However, Breakout on Daily TF from 452 - 453.
Weekly Closing above this level would
be a positive sign.
Upside Targets can be around 495 - 500
& if this level is Sustained, with Good
Volumes , we may witness 540 - 550.
Should not break 400, otherwise, we may see
heavy Selling pressure.

Bullish on All Time Frames.Bullish on All Time Frames.
Breakout above 46.50.
Already re-tested the Previous Breakout
around 38.
Immediate Support is around 42.50 - 44
Immediate Targets can be around 49 - 50
However, It has the potential to touch 59 - 60.
It should not Break 40 now.

Pakistan Petroleum Limited. Trade PlanPpl has formed a falling wedge pattern. It has a given a breakout and also retested it.
Bullish on Monthly and Weekly timeframes.

Technical Analysis of BIG BIRD FOODS Limited(BBFL), PSX
Technical Analysis of BIG BIRD FOODS Limited(BBFL), PSX
Falling Wedge Pattern , CMP : 50.15
Date: 18-03-2025
Analysis By : Ali Safwan
Pattern Formation: Falling Wedge
Potential Targets (TP Levels)
TP-1: Around 59.03 PKR
TP-2: Near 63.81PKR
TP-3: Extended target around 75.70 PKR
TP-3: Extended target around 82.61 PKR
Bullish Case:
If the price breaks above 52.47 with strong volume, it could confirm a bullish breakout, targeting TP1 till TP3 .
Bearish Case: If the price fails to break out, it may retest lower support levels at 46.08 and consolidate further.
Ideal Entry: A breakout above 52.47 PKR.
Stop Loss after Entry 49.50

NATF - PSX - SHOWING a Flag PatternNATF Stock Analysis:
- *Buying Opportunity:* NATF is providing a buying opportunity.
- *Buying Range:* 205-200
- *Stop Loss:* 195
- *Target Levels:*
- Initial target: 215
- Final target: 238
- *Key Notes:*
- Hold the position until the target is reached.
- Use stop loss to minimize potential losses.
