• Products
  • Community
  • Markets
  • Brokers
  • More
Get started
  • Markets
  • /Pakistan
  • /Stocks
  • /Ideas
Bullish on All Time Frames.Bullish on All Time Frames. Breakout above 46.50. Already re-tested the Previous Breakout around 38. Immediate Support is around 42.50 - 44 Immediate Targets can be around 49 - 50 However, It has the potential to touch 59 - 60. It should not Break 40 now.
PSX:PAELLong
by House-of-Technicals
Pakistan Petroleum Limited. Trade PlanPpl has formed a falling wedge pattern. It has a given a breakout and also retested it. Bullish on Monthly and Weekly timeframes.
PSX:PPLLong
by drsmoizali
11
Technical Analysis of BIG BIRD FOODS Limited(BBFL), PSX Technical Analysis of BIG BIRD FOODS Limited(BBFL), PSX Falling Wedge Pattern , CMP : 50.15 Date: 18-03-2025 Analysis By : Ali Safwan Pattern Formation: Falling Wedge Potential Targets (TP Levels) TP-1: Around 59.03 PKR TP-2: Near 63.81PKR TP-3: Extended target around 75.70 PKR TP-3: Extended target around 82.61 PKR Bullish Case: If the price breaks above 52.47 with strong volume, it could confirm a bullish breakout, targeting TP1 till TP3 . Bearish Case: If the price fails to break out, it may retest lower support levels at 46.08 and consolidate further. Ideal Entry: A breakout above 52.47 PKR. Stop Loss after Entry 49.50
PSX:BBFLLong
by ALIDX80
NATF - PSX - SHOWING a Flag PatternNATF Stock Analysis: - *Buying Opportunity:* NATF is providing a buying opportunity. - *Buying Range:* 205-200 - *Stop Loss:* 195 - *Target Levels:* - Initial target: 215 - Final target: 238 - *Key Notes:* - Hold the position until the target is reached. - Use stop loss to minimize potential losses.
PSX:NATFLong
by PSX_TradeWithTrend
MARI ENERGYMARI Stock Analysis: - *Bullish Movement:* MARI is showing a bullish movement. - *Buying Opportunity:* Any weakness in the stock price is a buying opportunity, especially for new buyers. - *Buying Range:* 600-580 - *Target Levels:* - Initial target: 670 - Final target: 720 - *Stop Loss Strategy:* Use a trailing stop loss to lock in profits and minimize potential losses.
PSX:MARILong
by PSX_TradeWithTrend
FFLFFL Stock Analysis: - *Buying Opportunity:* FFL is providing a buying opportunity. - *Strategy:* Adopting a "buy on dip, sell on strength" strategy. - *Buying Range:* 16.26 - 15.30 - *Stop Loss:* 14.70 - *Target Levels:* - First target: 17.50 - Second target: 19 - Final target: 21
PSX:FFLLong
by PSX_TradeWithTrend
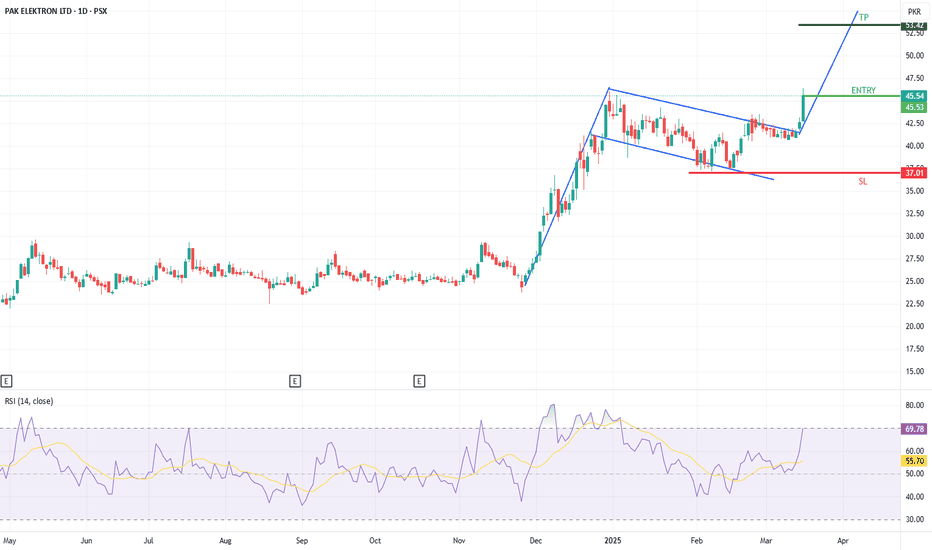
PAEL formed bullish flag patternpael has submitted breakout on daily time frame formed bullish flag pattern which indicates bullish momentum, buying is recommended at current levels.
PSX:PAELLong
by kashif1999
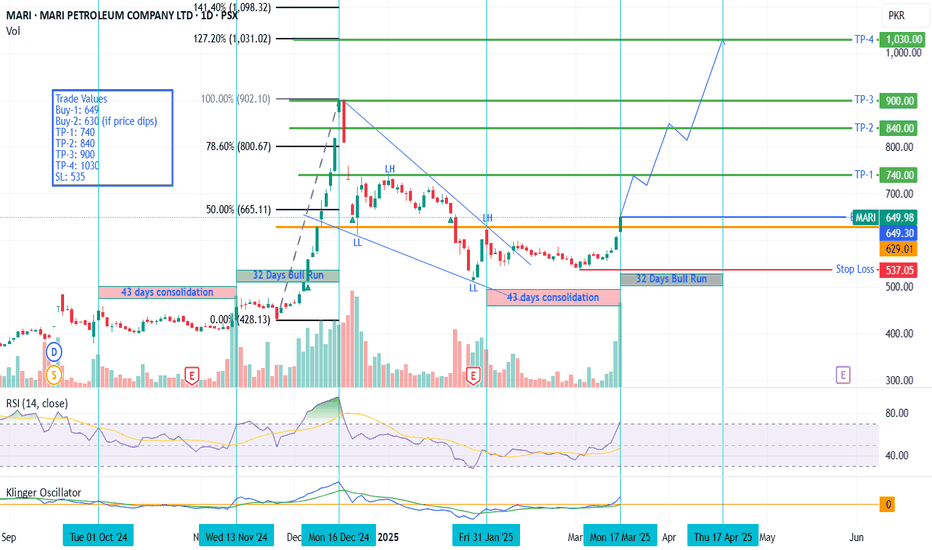
MARI - PSX - Beginning of a Bull Run MARI is the market leader of PSX. Historically, on time cycles it has shown consolidation period of 43 days before going into a bull run spanning around 32 days. Price after making the falling wedge has broken the structure upwards and now has even crossed the recent Lower High 627.40 as well - which signals a trend reversal towards bull run. Very good volumes are also experienced which are also confirmed by KVO which is a volume-based oscillator (blue line is almost at 60 degree angle going up). RSI is at 70 without any sign of reversal. Therefore, it would be a fair bet that we might see another cycle of bull run which should cross the previous all-time high (900.23) calculated on the basis of AB=CD or Fib based Extension tool. A minor retrace at key levels is expected where one should book profit. Trade Values Buy-1: 649 Buy-2: 630 (if price dips) TP-1: 740 TP-2: 840 TP-3: 900 TP-4: 1030 SL: 535
PSX:MARILong
by Golden_Spur
BreakoutBreakout on Daily TF. Good Buying Range: 98 - 99 It has the potential to touch 110 - 113 initially.
PSX:SEARL
by House-of-Technicals
MARI PROBABLY IN WAVE 'C' or '3' - LONGMARI is most probably in wave C or 3 which will be clarified will volume, as 3rd waves have the highest volume in general. We already have an active trade in this which I missed out to publish earlier but I'm doing my best to post it now. If either wave C or 3 count is correct then we are heading up but as I've taught we should always have an alternate wave count and in this case the best alternate count is a wave B correction. Wave B corrections can take any corrective pattern shapes therefore are very hard to pin point its wave count until it is completed, however the direction is still same but targets will get squeezed if its a B wave. Also the volume will not be as much of an impulse wave. Let see how this plays, Good Luck ! Disclaimer: The information presented in this wave analysis is intended solely for educational and informational purposes. It does not constitute financial or trading advice, nor should it be interpreted as a recommendation to buy or sell any securities.
PSX:MARILong
by KayJay
Updated
22
THCCLTHCCL analysis Trying to in into daily channel If successful then will touch channel top around 310
PSX:THCCLLong
by zahid_iqbal6220
KOHCKOHC Analysis look like as Cup and handle formation short target 410,420 need to break 440-445 cup nick line
PSX:KOHCLong
by zahid_iqbal6220
HUBCTrend is Bulish. Trade plan EP : 133 SL : 115 TP1 : 153 TP2: 168
PSX:HUBCLong
by Trad3MaX-AdEEL
PSO - PSX - SWING Trade CallOn daily TF, PSO has broken the falling wedge and now is moving upwards. Only likely resistance zone is close to previous all-time high. AB=CD Harmonic pattern has been drawn. KVO is moving upwards indicating bull run with RSI also testing 60. It is a good opportunity for getting into the SWING trade now spanning over around three months. Trade Values Buy-1: 396 Buy-2: 375 SL: 320 TP-1: 446 TP-2: 629
PSX:PSOLong
by Golden_Spur
EPCLA symmetrical triangle trade involves entering a position after price breaks out of a converging triangle pattern. Trade with confirmation (volume increase) and set stop-losses outside the pattern to manage risk.
PSX:EPCLLong
by B9A-88652-NisarAhmad
11
ATRL*ATRL Analysis *AB=CD Pattern formed in daily time frame *660 Important Resistance if break then will go up *Till Now no any Negative sign formed
PSX:ATRLLong
by zahid_iqbal6220
PSX - SSGC - Starting Bullish Trend PSX - SSGC - Starting Bullish Trend on daily time frame, and posting HH
PSX:SSGCLong
by psxumer1983
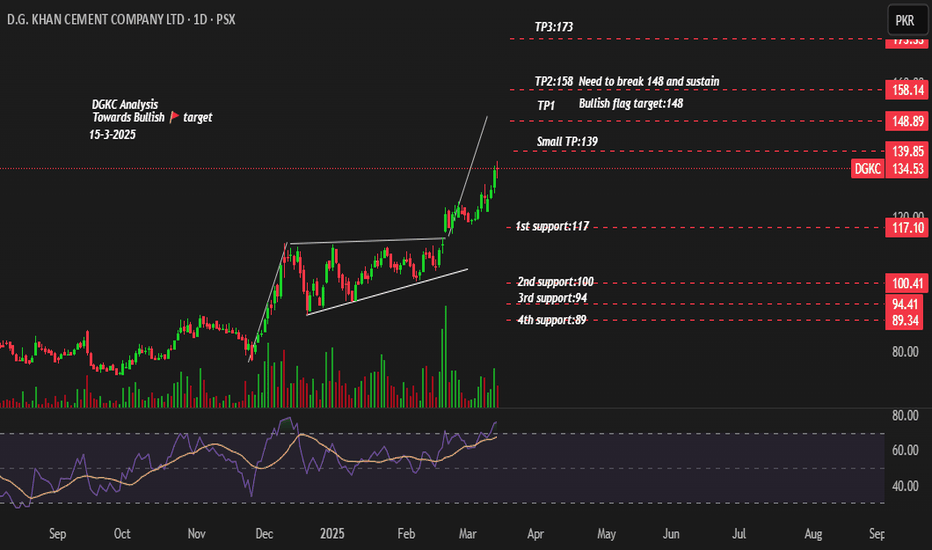
DGKCDGKC Analysis Towards Bullish Flag target Need to break flag target and sustain for further up
PSX:DGKCLong
by zahid_iqbal6220
BFBIOBFBIO Analysis Need to break 200 and sustain for go in up trend currently going up to touch downtrend line
PSX:BFBIOLong
by zahid_iqbal6220
ENGROHENGROH Analysis long term targets Head/shoulder pattern was formed in daily time frame but now bullish divergence formed hopefully it will go up Need to break downtrend line and sustain above 205-214
PSX:ENGROHLong
by zahid_iqbal6220
MARIMari Analysis AB=CD pattern projection Volumes are increasing Must need to break 635
PSX:MARILong
by zahid_iqbal6220
PPL Stock Analysis - *Price Range:* PPL stock is expected to move between 188-180. - *Buying Opportunity:* Any weakness in the stock price may provide a buying opportunity. - *Breakout Level:* If the stock closes above 188, it may trigger a bullish movement. - *Target Levels:* - Initial target: 198 - Final target: 213 - *Stop Loss:* Below 178
PSX:PPLLong
by PSX_TradeWithTrend
FCCL Breaks 8-Years Long Resistance Now Towards...!FCCL breaks a 8-years Long resistance. The result could be epic, it could either keep going higher or pause short-term and then blast through above the resistance. However, breakout is still in place burning some of the early buyers to explode higher without much effort.
PSX:FCCLLong
by jahanzaibM
112233445566778899101011111212131314141515161617171818191920202121222223232424252526262727282829293030313132323333343435353636373738383939404041414242
…999999

Select market data provided by ICE Data services. Select reference data provided by FactSet. Copyright © 2025 FactSet Research Systems Inc.© 2025 TradingView, Inc.

More than a product
  • Supercharts
Screeners
  • Stocks
  • ETFs
  • Bonds
  • Crypto coins
  • CEX pairs
  • DEX pairs
  • Pine
Heatmaps
  • Stocks
  • ETFs
  • Crypto
Calendars
  • Economic
  • Earnings
  • Dividends
More products
  • Yield curves
  • Options
  • News Flow
  • Pine Script®
Apps
  • Mobile
  • Desktop
Community
  • Social network
  • Wall of Love
  • Refer a friend
  • House Rules
  • Moderators
Ideas
  • Trading
  • Education
  • Editors' picks
Pine Script
  • Indicators & strategies
  • Wizards
  • Freelancers
Tools & subscriptions
  • Features
  • Pricing
  • Market data
Trading
  • Overview
  • Brokers
Special offers
  • CME Group futures
  • Eurex futures
  • US stocks bundle
About company
  • Who we are
  • Manifesto
  • Athletes
  • Blog
  • Careers
  • Media kit
Merch
  • TradingView store
  • Tarot cards for traders
  • The C63 TradeTime
Policies & security
  • Terms of Use
  • Disclaimer
  • Privacy Policy
  • Cookies Policy
  • Accessibility Statement
  • Security vulnerability
  • Status page
Business solutions
  • Widgets
  • Charting libraries
  • Lightweight Charts™
  • Advanced Charts
  • Trading Platform
Growth opportunities
  • Advertising
  • Brokerage integration
  • Partner program
  • Education program
Community
  • Social network
  • Wall of Love
  • Refer a friend
  • House Rules
  • Moderators
Ideas
  • Trading
  • Education
  • Editors' picks
Pine Script
  • Indicators & strategies
  • Wizards
  • Freelancers
Business solutions
  • Widgets
  • Charting libraries
  • Lightweight Charts™
  • Advanced Charts
  • Trading Platform
Growth opportunities
  • Advertising
  • Brokerage integration
  • Partner program
  • Education program
Look FirstLook First