HCAR Way ForwardRespecting its trend line, HCAR can take a correction till 266.
Its Next targets can be 558 once it breaches its recent high of 355.
Short term resistance areas are 298, 311, 328 and 355.
Support areas are 285 and 266. Stop loss 244.

Short term trade in PIOC , H1 time frameBuy PIOC@ 220, near trendline support , for TP @220 and stoploss below 295

CPHL is showing upward momentumCPHL is in upward trend, currently price has taken good correction and know showing upward signs. Good time to buy at current price.

CPHL is showing upward momentumCPHL is in upward trend, currently price has taken good correction and know showing upward signs.good time to buy at current price.
THCCL - PSX - Daily TF - LONG (Buy) Trade call RSI 14 indicator is above 70 line and there is no bearish divergence yet.
Klinger Oscillator is above '0' indicating a bullish state; however, Klinger Oscillator (Blue) is yet to cross over the trigger line (green).
EMA 89 line is also below the price chart indicating a bull run.
AB=CD Pattern has been drawn for TP1.
Pole and Flag pattern has been drawn for TP2.
THCCL - LONG (Buy Call)
Buy : Instant @ Market price : 94~95
TP1: 120.35 (Expected TP 22 Oct 2024 )
TP2: 130.25

FCCL - PSX - Technical AnalysisFauji Cement Co Ltd (FCCL) share price is almost at Daily Channel Support Level. Technically, price may bounce from this support.
However, a SHARK Harmonic pattern has been drawn (93% compliant) which if followed will drop the prices significantly. KVO is dipping below zero level indicating a Bear run; additionally RSI is also dipping which supports the dropping of prices. Until and unless some fundamental element or good news kicks in price should go till Buy-2 level. In case price drops below 29 then price will free fall till 29.27.
Trade Values
Buy-1: 34.07
Buy-2: 33.87
SL: 29.27
TP-1: 40
TP-2:47

Exide Pakistan - LongExide is making multiple bullish patterns
1- Inverse head and shoulder
2- Cup and Handle
3- Bullish Flag
4- ABCD pattern
It may go down to 670 at the worst, but may also revert back from here to complete CD leg which may touch 1600.
Short term target: 1100
Medium term target: 1600
Long term target: 2000

POWER - PSX - Tech AnalysisPower after the pressure of selling has started to recover.
Price is just under the 8/1 resistance line of upper Gann fan. Once price crosses it then this line will start acting as support. Just see the repetition of the triangle pattern (Orange).
RSI is also moving upwards and at present it is around 57, therefore, there is sufficient room to consider retracement which previously happened at 75 and 86 respectively.
KVO is just below zero level but likely to catch up.
Trade Values
Buy Mkt: 9.20
TP-1: 9.96 (Price Action Resistance)
TP-2: 11.80 (AB=CD)
SL: 8.20 (below previous HL)

Feroz - Long Feroz is making cup and handle formation. Further, it is in an upward trend, breaking which may lead it to go beyond 550 (Exact medium term targets mentioned in chart). In the longer run, (1.5 to 2 years), it may again touch its all time high (900+).

FCCL - PSX - Buy Trade CallFundamentally, FCCL is progressing steadily. Its recent quarterly report ending Dec 2024 is a little bit better than previous quarter ending Sep 2024. Similarly, as compared to previous year same quarter, its revenue has almost jumped 25% (from 20B Dec 2023 to 25B 2024). Historically, Quarter ending March shows some lesser revenue due to bit lesser sales during winter season whose impact is depicted in March. Therefore, it should not be a big surprise if earnings drop in quarter ending Mar 2025. However, share price might take a minor correction before moving up. This is potentially a very good SCRIPT whose share price may be doubled in next 10 months by end Dec 2025. Therefore, it can be kept as an Investment stock.
Technically analyzing the script, we see that it is moving upwards in a regression channel. Also Daily Support line has always been honored by the SCRIPT since going into bull run in Aug 2024. Price is well above EMA 89 suggesting continuation of bull run. Presently the price is above EMA 21 and since it is likely to act as a magnet, therefore, price should drop a little to test this line (BUY-1). Additionally, potential Cypher Harmonic pattern has been drawn, which if complied then price can even test that zone too (BUY-2).
There is no divergence on RSI and RSI still has some room to get into potential reversal zone. However, volumes are a bit low. KVO indicator is dipping on trigger line below Zero level also suggest minor dipping in price is expected to test Buy-2 level.
Trade Values
Buy-1: 40.66
Buy-2: 38.74
SL: 36.02
TP-1: 49
TP-2:59

Some Positivity Seen...0.5% Fib level retracement &
Also, Confirmed HL around 29 - 30.
Important Support lies around 32.50 - 34.70
Should not Break 29, otherwise, we may witness
further Selling Pressure.
If 36.30 is Sustained, we may witness 38 - 38.50
which is again a Strong Resistance.
Stock will be in uptrend again if is Sustains 38.50
& it may hit 49 - 50 again. Also because , it seems
as now it is Re-testing the Breakout level around 34.50 - 35.

HBL PROBABLY IN WAVE 'A' OF CORRECTIVE PATTERN DOWNHBL is most probably in a corrective wave down which has started after a strong impulse wave up. Currently the market is in wave A of the corrective pattern downwards.
As a good practice one should always look into an alternate wave count, my alternate count
suggests that we are in a bigger WXYXZ corrective wave upwards and currently are in wave Y
which is almost complete and suggest price to move upwards.
My preferred wave count is ABC pattern down with a target price range around 122, We will
enter long positions around that range OR We will enter long positions once price break above blue resistance line of wave Y
Also in addition to our ABC wave count down a Double Top pattern has emerged, double top pattern has a high pullback percentage therefore anyone who wants to short sell the stock should wait for the price to break below the last swing low.
Remember volume is the key indicator here if the price does break the last swing low.
Let see how this plays, Good Luck !
Disclaimer: This is for informational purposes only; anyone taking trades using this idea will be liable for their own profit or loss.

ENGROH Possibly Established A LowENGROH (184.50) has completed the 61.8% Fibonacci retracement of its 134.36 to 287.88 rally at 179.76, marking a decline of over 35% from its January 2025 high of 287.88. Based on my wave count, the correction appears to be complete, with a potential low established at 177.05.
A sustained move above 188.50 would confirm emerging strength, initially targeting 194.60. Such a move would reinforce the bullish reversal structure, setting the stage for a minimum upside towards 206.30, with the potential to extend to 226.
Traders should closely monitor price action above 188.50, particularly on expanding volume, as this would provide a strong buy signal for further upside.

GGL- PSX - Symmetrical TriangleGGL has formed a symmetrical triangle in the 1D time frame. Look for the upward breakout or downward breakdown for bullish or bearish entry accordingly.

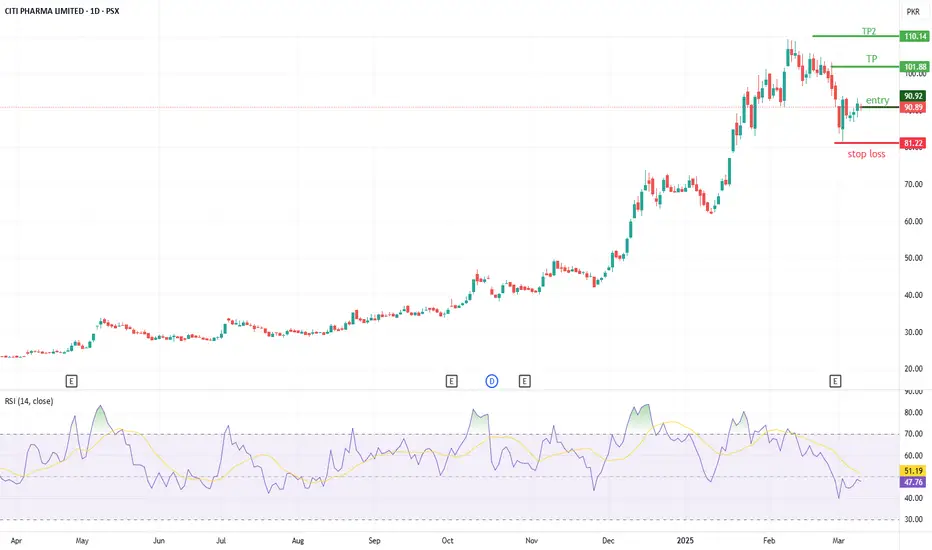
City Pharma LimitedStrength
1)According to dow theory city pharma limited is following uptrend and never break recent lower high.
2)Creating clean AB:CD pattern on daily and weekly time frame.
3) Completed 50 to 60% retracement on daily and weekly time frame and it looks good for uptrend from current price level.
Weakness
1) Price level of 92 to 93 showing rejection if it sustain above this price then we can expect good uptrend

LCI Next TargetFrom latest bottom till the breakout level which conservatively I'll take at 1159, the most possible target is ~1800.

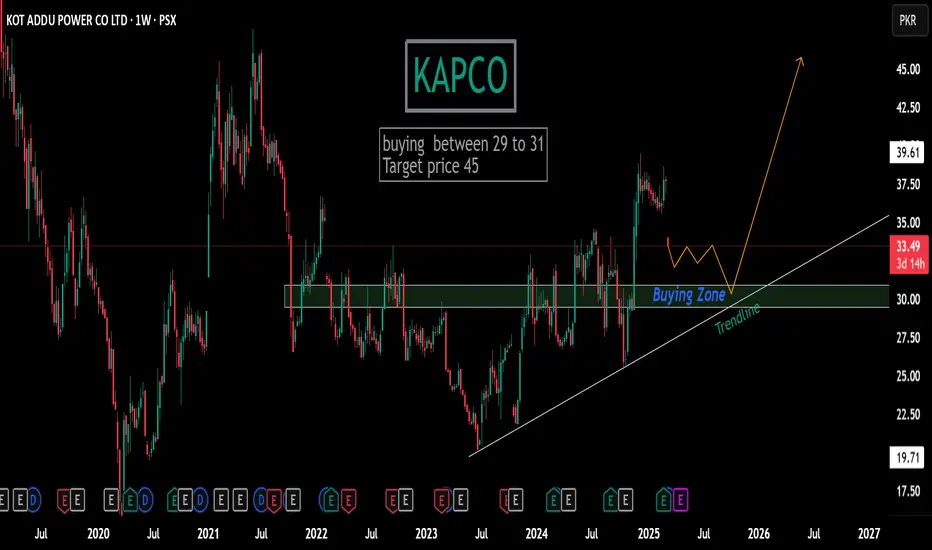
KAPCOinvestment base Trade.
Bulish trendline
after XD price retrac at support zone with test bulish trendline .
buying 29 to 31
Target price : 45 :
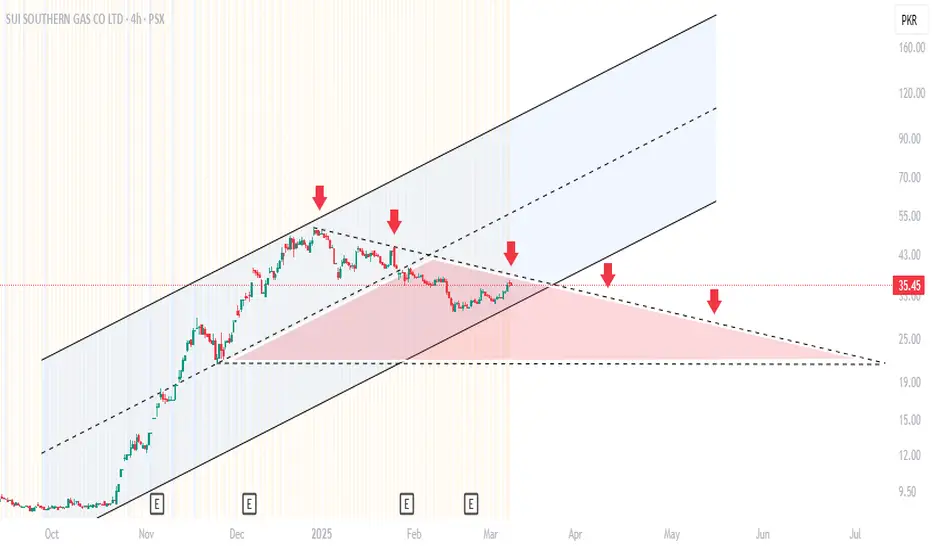
Understanding SSGC’s Upcoming Bullish Trend OR Sideways ?The stock was in a strong uptrend from October to January, staying within an ascending channel.The stock faced multiple rejections at the upper boundary of the channel.
Each time it approached resistance, it failed to sustain the momentum and pulled back.
Watchable zone
The lower trendline is acting as a support. If this support is broken, the price may drop towards PKR 25.00 - 22.00.
Sideways (Higher Probability)
A break below 32 PKR will confirm a sideway trend with range bound activity (24.00 - 28.00)
Bullish Case (less likely )
If the price breaks above 38 PKR,This would signal a bullish reversal, with potential upside targets at 46-48PKR.
Understanding BOP’s Bullish Trendstock’s strong uptrend, trading within an ascending channel, and currently consolidating within a resistance zone.
The price is currently consolidating within a red resistance box, indicating that it is facing some selling pressure.A breakout above this zone could trigger another bullish rally
Immediate resistance: Around 12.20-13.50 PKR, where the stock is currently consolidating.
12.00-12.20 PKR, act as support for price retraces.
If the price successfully breaks out above 13.50 PKR, it may continue its uptrend toward the next resistance within the channel (15.75-16.25)
However, if it fails to break out, a short-term pullback to the lower trendline (around 12.00 PKR) could provide a better buying opportunity.

DGKC [ DG Khan Cement] Chart Technical Analysis, PSX DGKC Stock Analysis
CMP : 125.88 , 10-03-2025
The price is currently moving within an ascending channel, indicating a bullish trend.
A breakout above the upper boundary could lead to further upward momentum.
Premium Resistance Zone (130.00 - 135.00):
This is a critical resistance area where the stock may face selling pressure.
A breakout above this zone with strong volume could signal further upside potential.
Daily Fibonacci Levels:
The price is currently trading near the 23.6% Fibonacci retracement (117.49), suggesting strong support.
The next support levels are 109.75 (38.2%), 103.50 (50%), and 97.24 (61.8%).
Support Zones:
There are two key support levels around 110 and 100, which coincide with Fibonacci retracement zones.
If the price corrects, these areas could provide buying opportunities.
Potential Price Movement (Dashed Projection):
The dotted lines suggest a possible retest of the resistance zone (130-135) before a correction or continuation.
If rejected from resistance, the stock may pull back to the lower trendline before resuming its uptrend.
200-Day Moving Average:
The red line (200-day MA) is trending upwards, indicating long-term bullish sentiment.
Conclusion & Trading Plan:
Bullish Scenario: A breakout above 130 could lead to 135-140 levels.
Bearish Scenario: A rejection from resistance may cause a pullback to 110-115.
Support Levels to Watch: 110, 100
Resistance Levels to Watch: 130, 135
Disclaimer:
This analysis is for educational and informational purposes only. It represents my personal views based on technical analysis and should not be considered as financial advice or a buy/sell recommendation. Trading and investing involve risk, and past performance does not guarantee future results. Always conduct your own research and consult with a qualified financial advisor before making any trading decisions. You are solely responsible for your own investment choices.

FCCL : Will It Retrace Before the Next Rally?On previous Call 4th mar 2025 , Stock met his target . Now next Short-term traders may wait for a retracement to 40-41 PKR before entering long positions.
The stock is moving within an ascending channel, with price action respecting both the support and resistance trendlines.
The price is currently near the upper resistance of this channel,Around 45-PKR, where price is struggling to break higher. suggesting a potential correction before another move higher.

Recently made LL on Shorter TF, but..Recently made LL on Shorter TF,
but also it is a Support level with Double Bottom.
Hidden Bullish Divergence on Daily TF.
Immediate Support lies around 86 - 89
& Immediate Resistance is around 91 - 92.
Sustaining 91 - 92 on Weekly TF, would
lead it towards 98 - 99.
Ultimate Target (if 109-110) is Sustained,
is around 128 - 130.
Should not break 81 now.

SSGC - AB = CD pattern SSGC forming AB = CD pattern. made bullish flag and breakout now heading towards completion of CD pattern
