Same Support level tested againUpdate as on 06-03-2025
Support level that was
mentioned a month ago, again played
well.
Now again 600 - 630 is the resistance for now.

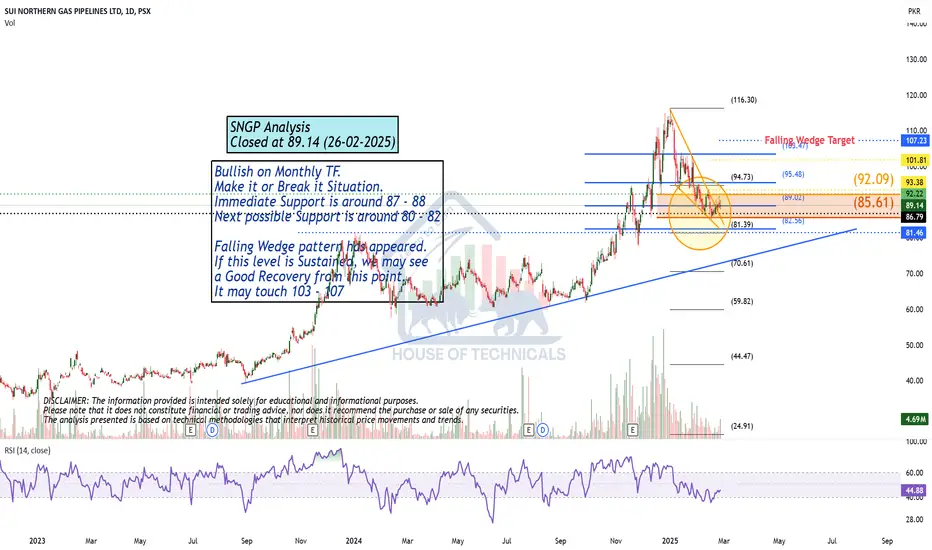
Bullish on Monthly TF.Bullish on Monthly TF.
Make it or Break it Situation.
Immediate Support is around 87 - 88
Next possible Support is around 80 - 82
Falling Wedge pattern has appeared.
If this level is Sustained, we may see
a Good Recovery from this point.
It may touch 103 - 107
CPHL Analysis Stock Analysis By : Ali Safwan
On : 06 March 2025
Price Action & Trend
Stock is in a correction phase, with retracement from highs.
Weekly Support Strength trendline is still intact, but the price is testing it.
If price breaks below this trendline, further downside correction can happen.
Consolidation Zone
The gray area (~63.90 - 74.60 PKR) shows past consolidation.
If the price drops further, this area could act as a demand zone.
Volume & Momentum
Volume has declined compared to the earlier rally.
Momentum is weakening, but price is near key support.

Good 2024 result. Price action is waiting for sentimentThe company gave good EPS for the year ended Dec 2024.
Now it is waiting for the micro economy fundamentals. A lower interest rates will lead the price to break the triangle up side. the target price is 1170
Else going more down till 580 area

CPHILtrendline test and print bulish engulf candle. aslo fib level 0.50%
Trade Plan
Buy 88
target 109


LOTCHEM Gearing Up for a Bullish Comeback? OTCHEM appears to be forming a potential bullish reversal after finding strong support near 18.50-19.00. The stock is attempting to break out of its consolidation phase, with RSI stabilizing near 50, signaling a possible shift in momentum. A decisive move above 20.50-21.00 with strong volume could trigger a rally toward 23.50-24.00, making it a key breakout zone for traders. With volume still on the lower side, a spike in buying interest could confirm the uptrend. Keep an eye on this level—LOTCHEM might just be setting up for its next big move!

a Bounce is expected from the Current level but Resistance aheada Bounce is expected from the Current level.
but 21 - 21.20 is a Very Strong Resistance.
as of now. & if it is Crossed with Good Volumes
& Sustained, we may see the price touching 22.50 - 23.50
& lets enjoy further upside above 24 - 25.
However, Monthly Support is around 16 - 16.50.

Perfect ABCD Pattern on Weekly TF.Perfect ABCD Pattern on Weekly TF.
161 - 165 is a Good Support now.
Next Important Support level is around 143 - 145.
Company Directors' are themselves buying this
share @ around 171.

BEST BUY AT 45 LEVEL AFTER Q3 2025 RESULStill the buy is conditional, subject to good result in next quarter, Q3 2025.
Previous quarter result was not satisfactory so i myself adjusted my porftolfio.
ILP deserve rest and i put in my reserved player. Will look for a bullish signal in Apr-May 2025 after Quarter 3 result announcement.
It has a good suppoer at 45 area.
If fall down then we are looking it at 28 area.
Its my potentional player for my portfolio but for now, ILP is not in my Best of 20 players for 2025.

Morning Star Formation on Daily TF.Morning Star Formation on Daily TF.
No Bearish Divergence yet that has matured.
a Very Important Support lies arround 173.50 - 177.50
Beautifully printed HL & Moving Up now.
Crossing & Sustaining 194 may lead it towards
200+ with ultimate target around 230.

Bullish Divergence on Shorter TFImmediate Support seems to be
around 82 - 84.
If this level is not sustained, we
may witness 65 - 72 range.
However, Bullish Divergence on Shorter
time frame may give it a spike of 3-5 rupees.

PSX FCCL Analysis: Entry Points, Targets (Gain 8%-15%-22%)Market Structure & Trend
The stock is maintaining an uptrend, supported by a rising trendline. The price is currently near a potential support level, making it an interesting point for buyers.
Buy Zones & Targets:
Buy-1: 34-36 PKR → Target 40 & 46 PKR
Buy-2: 40-42 PKR → Target 44 & 48 PKR

Airlink Technical Analysis: Potential Bullish SetupAirlink is moving in an uptrend, holding above a trendline, and is currently testing the 0.5 Fibonacci retracement level, a common area of support where buyers often step in. Price is also testing the 89-day EMA, a Fibonacci number that has historically acted as support, reinforcing the bullish outlook. Airlink is also a fundamentally strong company.
Trading Recommendations:
Buy 1 (CMP): 178
Buy 2: 166
Stop-Loss (Conservative): Closing below 118 (below the most recent higher low)
Stop-Loss (Aggressive): Closing below 140 (horizontal support level & below trendline)
Take Profit 1: 226
Take Profit 2: 268
Take Profit 3: Open
Happy trading!

NETSOL Technologies (PSX) Hits Oversold Levels NETSOL Technologies Ltd. (PSX: NETSOL) is currently trading at 130.16 PKR, testing a critical support zone after a prolonged downtrend. The stock has been forming lower highs and lower lows, signaling persistent selling pressure.
📉 Technical Breakdown:
RSI (14) at 22.92 – Deep in the oversold zone, indicating a possible short-term bounce.
Price nearing a key support level at 130 PKR – A break below this could push the stock towards 120–125 PKR.
If a bullish RSI divergence or reversal pattern (e.g., hammer, bullish engulfing) appears, a rebound toward 135–140 PKR may be possible.
🚨 Trading Plan:
🔹 Bullish Case: Wait for confirmation of reversal with increasing volume before entering long positions.
🔹 Bearish Case: A breakdown below 130 PKR with strong volume could signal further downside.
📊 Keeping a close watch for a potential trend shift! What’s your outlook? Comment below! 👇🔥 #PSX #NETSOL #Trading #TechnicalAnalysis.

MLCF – Breakout vs. Fakeout – What to Watch?
:
The stock is testing a long-term resistance trendline, which has previously acted as a strong barrier.
A breakout should be confirmed with strong volume for sustainability.
If a rejection occurs, price action could see a short-term pullback before retesting resistance.
Key price target post-breakout: 58+ PKR
Potential Buying Zones:
Buy-1: Around 48-16%
Buy-2: Around 44-22%

NBP Stock Analysis: Next 25% Gain NBP’s price movement within an upward-sloping channel
Lower Bound (~PKR 60-65) → Strong support zone.
Upper Bound (~PKR 88-90) → Strong resistance zone.
Trading Strategy
Bullish Bias: Buy on dips near mid-channel support (~74-76 PKR) and target 88-90 PKR.
Buy-1 : 74-15%
Buy-2 : 70-20%
Buy-3 : 65-33%

CITI PHARMA-Sideways Trend for 22% & 35% gainShort-Term Outlook: The stock is bearish, as indicated by the RSI, Klinger Oscillator, and price action near support levels.
Potential Entry Points: If the RSI starts climbing above 35-40, and the price holds support at 85.60 or 80.01, it could present a buying opportunity.
Risk Factor: If the price breaks below 80.01, expect further downside towards 72.04 or lower.
Confirmation Needed: Look for increased volume and positive oscillator movement before making bullish trades.
Buy-1: 80
Buy-2: 76
Buy-3: 72

MCB Bank Pakistan – Smart Money Concept (SMC) Perspective### **MCB Bank Pakistan – Smart Money Concept (SMC) Perspective 📊🔥**
I Have identified the **Yearly Breaker Block** overlapping with a **Monthly Bullish Order Block (OB)** and a **Fair Value Gap (FVG)**, then this setup signals a potential **liquidity grab** before a strong bullish move. 🚀
#### **1️⃣ Yearly Breaker Block & Monthly Bullish OB 📉➡️📈**
- The **Breaker Block** acting as a resistance suggests that price may need to mitigate unfilled orders before a strong reversal.
- **FVG presence** indicates institutional activity and the need for price to rebalance before continuing higher.
#### **2️⃣ Volume Imbalance & Price Decline 🔻**
- The presence of **Volume Imbalance** suggests that price might push lower to the **Monthly OB**, where Smart Money could accumulate long positions.
- **Liquidity Hunts** below OB could fuel a **bullish reaction** from this level.
#### **3️⃣ Liquidity Grab & All-Time High (ATH) Break 🚀**
- If price taps into **Monthly OB** and shows bullish confirmation (**Market Structure Shift - MSS**), we could see a rally toward **ATH breakout**.
- This move aligns with **Smart Money's agenda** to trap sellers and fuel a strong uptrend.
### **Trading Plan (Execution Strategy) 🎯**
✅ **Confirmation:** Look for **Bullish Engulfing / MSS** at **Monthly OB**.
✅ **Entry:** Use **Limit Orders** in OB or wait for **Lower Time Frame (LTF) Confirmation**.
✅ **Stop Loss:** Below **Monthly OB** to avoid liquidity sweeps.
✅ **Take Profit:** First **Previous High**, then **All-Time High (ATH)**.
📌 **Conclusion:**
This setup suggests a **High-Probability Smart Money Trade**, where price may drop into **Monthly OB**, grab liquidity, and then push to break **ATH**. **Patience & Confirmation** will be key! 🔥💰📈

HCAR Weekly AnalysisHCAR is near weekly trend line support , buy attempt can be taken around 280 with stoploss of below 240, reward is much high than risk. TP1@400 and TP 2@600


