
ABOT Technical Analysis: Potential Bullish SetupABOT is showing a solid uptrend, currently holding within the 0.618-0.78 Fibonacci retracement zone—a key support area. It's respecting its trendline, and we're seeing bullish divergence in both volume and RSI, hinting at more buyers stepping in, which is a good sign. Plus, ABOT's fundamentals are strong!
Trading Recommendations:
Buy 1 (CMP): 1038
Buy 2: 1000
Stop-Loss (Closing Basis): 890
Target 1: 1295
Target 2: Open
Happy trading!

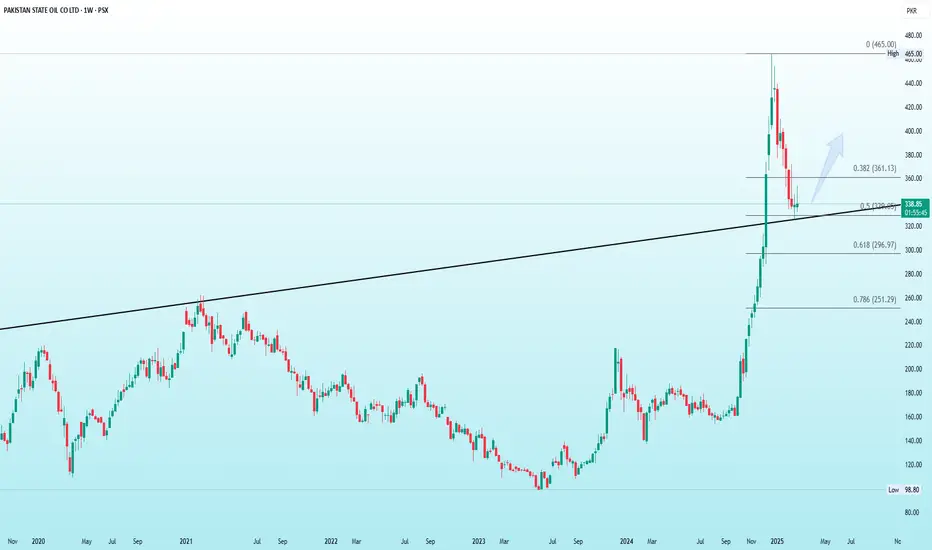
PSO at a Critical Juncture: Uptrend Continuation or Deeper Pull?PSO shows a strong uptrend followed by a significant pullback from its recent peak of 465. The price has retraced to 338, aligning with key Fibonacci levels, with 361 (0.382) acting as resistance and 322 (0.5) providing support near a long-term trendline. Holding above this trendline could signal a continuation of the uptrend, while a break below 322 may lead to further downside towards 296 (0.618 retracement) or even 251 (0.786 retracement). A bullish recovery would require reclaiming 361, while failure to hold support levels could extend the correction. Overall, the trend remains bullish in the long run if the price stays above key support zones.
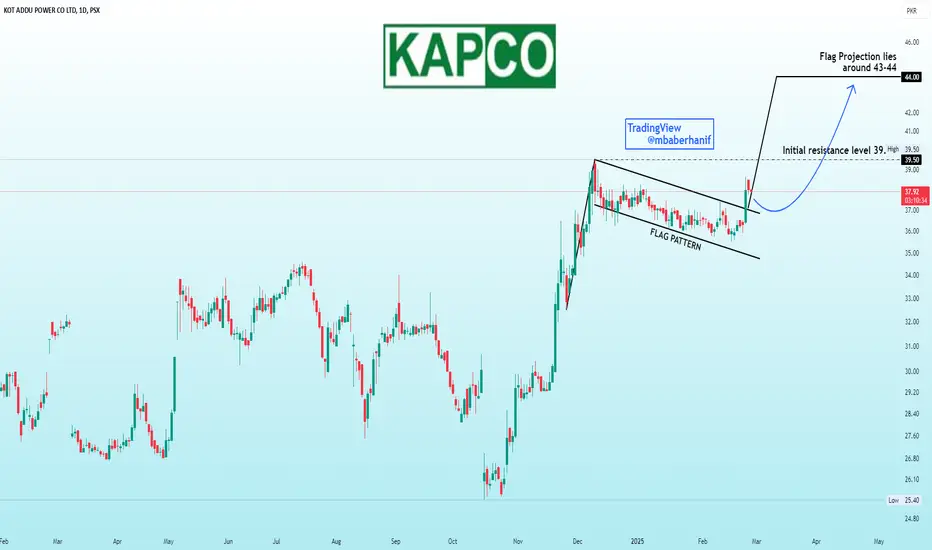
KAPCO – Bullish Flag Pattern Breakout in PlayKAPCO is forming a bullish flag pattern, indicating a strong uptrend continuation. The stock is currently consolidating within the flag, and a break above 39.50 with strong volume would confirm the breakout, potentially leading to a rally towards 42-43. This level also marks a double top resistance, where some short-term rejection could be expected. However, if the breakout sustains with increased buying pressure, it could pave the way for further upside. Traders should monitor volume closely for confirmation before entering a position.

Third time's the Charm? Waiting for Re-Entry on DOW MonthlyAfter successfully buying and offloading chunks twice, I’m now eagerly waiting for the price to revisit my Potential Entry Box to buy back the already offloaded chunk. If the pattern holds, I’ll likely offload again in the next target zone (new offload chunk box). 😊
Before you launch a rocket of anger 🚀 😅 Let me tell you that Last time, I forgot to take a screenshot of the first buy & offload chunk area & updated my chart straight away. 😅
Today, I finally learned how to add an image! 🎉
Note: I’m still learning, this is NOT financial advice. Do your own research, and I’m happy to have constructive criticism! Let’s learn together. 📈

Currently making LH LLs but..Weekly & Monthly Closing above 60.67 would be a Positive Sign.
Though currently making LH LLs, but
Bullish Divergence on Daily TF is another Positive Sign.
Upside levels can be around 65 - 67
However, in extreme pressure, it may touch around 53 - 55
& that would be an Important Support level.

KAPCO - Flag PatternThe stock displays a bullish flag pattern on strong volume, trading confidently above both the 20 and 200-day EMAs, suggesting robust upward momentum. Previous session shows a break out of the flag and price closed +2.45% above it. Initial resistance lies around 39.50 which is the formation of double top pattern from where short term rejection can be seen. However, a decisive break above the resistance level will confirm the continuation of the bullish trend and flag projection lies around 43-44.
PSO could drop todayPSO is cross below my created indicator may be it drop below to 340 and 340. Wait for it to entre bullish zone.
Note: This is not a buy sell call, trade at your own will and use stop loss.

Buy on DipsShort to Medium Term ULTIMATE TARGETS CAN BE 25 - 26
& Then 40 -45
Best Buying Price would be around 11 - 12 (if it comes).

Bullish on All Time Frames.Bullish on All Time Frames.
Crossing & Sustaining 208 will lead
it towards 260 - 265 & then 300+
Immediate Supports lies around 200 &
then around 183 - 187
Fresh Entry can be made once 208 is
Sustained.

Beautifully making HH HL.Beautifully making HH HL.
Immediate Support is around 29 - 29.30
Monthly Closing above 29.13 would be a
healthy sign.
If 29 is Not Sustained, Next Support would be
around 24.30 - 26.30
& if 29 is Sustained,34 - 35 can be witnessed.
Immediate small Resistance is around 31.55
Should Not Break 24 even in Worst Case.

OGDC-LONGstrong fundamental stock standing on its support and Lower trendline it can bullish from here and
moves upward upto its target o upper trend line a golden chance of 90-100 % return

Monthly Breakout but still...Monthly Breakout; However, still at Important Resistance zone.
Once 10.70 is Crossed & Sustained, 12 - 12.50 can be easy Targets.
It has given a Breakout from Rectangular Channel around 8.70 - 9.
& also re-tested it.
Hidden Bullish Divergence has also appeared.
as of Now, it should not break 6.60.

Morning Star Formation on Weekly TF.Morning Star Formation on Weekly TF.
Strong Trendline Support around 9.40 - 9.50
However, Accumulation can be started from
Current Level (10 - 10.50);
Should not Break 8 (even in worst cases)
Upside Targets can be around 13 - 14 & then
16 -18

HUB POWER CO LTD (HUBC) on the Pakistan Stock Exchange (PSX)HUB POWER CO LTD (HUBC) on the Pakistan Stock Exchange (PSX). Here’s a breakdown of key observations:
1. Price Action & Trendlines
The stock appears to have broken out of a long-term downward trendline.
The breakout level seems to be around 134-135 PKR, which is currently being tested.
There is a potential inverse head and shoulders pattern, indicating a possible trend reversal.
The target projection post-breakout is 195.91 PKR, suggesting a bullish move.
2. Volume Analysis
There is a noticeable increase in volume, supporting the breakout.
A sustained volume increase would confirm the breakout's strength.
3. RSI Indicator (Relative Strength Index)
The RSI is at 58.27, indicating bullish momentum but still below the overbought zone (70+).
If RSI continues to rise, it may signal further upward movement.
4. Support & Resistance Levels
Support: 130-134 PKR (Breakout Zone)
Resistance: 195.91 PKR (Target)
5. Overall Sentiment
Bullish breakout confirmed with volume and trendline break.
Watch for a retest of 130-134 PKR. If it holds, the stock may continue upward.
Confirmation of a rally towards 195.91 PKR will depend on sustained buying pressure.

LCI - Lucy Core Industries - BuyBuying signal generated yesterday, since the move was big, so a correction was due today, if everything is good it will possibly do small correction and then will move up in coming days. partial profit is at resistance zone, hold for more as it can go sideways after hitting resistance or may come down even.

PSX FFL TRADE IDEA LOOKING STRONG ON H2 AND H4FFL IS LOOKING STRONGON H2 AND H4. The stock retest its equal low where all of the big liquidity was resting at 14.50 Now the stock is heading to the next h2 resistance the breakout at H2 resistance with good volume will start a quick uptrend. Watch for volumes and orderbook.
The next target will be the previous lower low around 16.
Trading above EMA 21 at H2 AND H4.
VOLUME GAINER.
Buy before breakout if the volumes are rising watch on shorter time frame and see how the price reacts near the resistance. WATCH THE ORDERBOOK MUST and see what is being played there.

BullishBullish on All Time Frames.
Strong Bullish Divergence on Weekly TF.
However an Important Resistance is around 15.70 - 16.
If Crossed & Sustained with Good Volumes, we
may witness 18 - 19.
Bearish Divergence on Daily TF may show some
Selling pressure.
In Simple Words: Stock is Good to Hold with Proper
Stoploss (as per your own Risk appetite.)
For Fresh Entry, following ranges can be considered
1. 14 - 14.15
2. 12 - 12.10

Though Still Bearish but...Though Still Bearish but Bullish Divergence on Daily TF.
This Week's Closing is Important (should be above 45).
However, if 45 is Not Sustained, we may witness
more Selling Pressure may be around 25, not
immediately but may be in couple of months.
Do not forget that BBFL has reported Excellent
Financial Results for the Half Year Ended 31st Dec.2024

DgkcFinally starting to rally after long consolidation.potential leader if this bull market continues.

Chart is a technical analysis of TREET Corp Ltd (PSX: TREET).Key Observations:
Price Action:
Current price: 22.20 PKR
Recent high: 23.27 PKR
Resistance level at 24.60 PKR
Support around 21.00 PKR
Price has broken above a trendline, signaling a potential bullish breakout.
Technical Patterns:
Head and Shoulders Formation in the middle of the chart, followed by a breakout.
Trendlines (dashed red and green) indicate a downtrend reversal.
Measured move projection suggests potential targets at 23.27 PKR and 24.60 PKR.
Momentum Indicators:
RSI (Relative Strength Index) is around 51.39, indicating neutral momentum.
Bearish Divergence seen in RSI (lower highs in RSI vs. higher highs in price), which could indicate weakening momentum.
Volume spikes suggest buying interest.
Conclusion:
The price has recently broken out of a consolidation phase and is testing resistance levels.
If TREET sustains above 22.20, it could test 23.27 and 24.60.
However, the RSI bearish divergence warns of possible exhaustion.
If the price falls below 21.00, a retest of lower supports (around 19.00) could occur.

KEL🚀 Stock Alert: KEL
📈 Investment View: Technically Bullish 📈
🔍 Quick Info:
📈 Entry Level: 4.50
🎯 First Target: 5
🎯 Second Target: 5.50
⚠ Stop Loss: 4
⏳ Nature of Trade: Short Term (Scalping)
📉 Risk Level: Medium
☪ Shariah Compliant: YES
💰 Dividend Paying: NO
📰 Technical View: The price action pull back from its trend line and currently trading in a consolidation phase. Upon break out price can test its initial resistance around 5 and upon breaching secondary resistance lies around 5.50. Use stop loss at 4.50 if it breaks downward to manage risk.

GGGL: Potential Weekly Breakout TradeGGGL presents an interesting weekly trading opportunity. The stock recently broke out from an approximately 100-week consolidation period, signaling a potential long-term upside. Following the breakout, the price successfully retested the weekly support zone around 8. The weekly candle closed at the 0.5 Fibonacci retracement level, a key area for potential reversals. A bullish divergence initially signaled potential upside, and although the price subsequently entered a consolidation phase, the RSI has now synced with the price action, suggesting renewed upward momentum.
Trading Recommendations:
Buy 1 (CMP): 8.5
Buy 2: 7
Stop-Loss: Closing below 5.5
Take Profit 1: 10.5
Other Potential Targets: 16, 20, and 30 (near all-time highs)
Happy trading!
