MUGHAL - Following its ChannelBreakout may happen at 92 and we may see Mughal touching 130 (Channel top) once again. What happens if it breaks Channel top resistance this time? We'll see later :)
This is not a buy / sell call, just my own opinion.

CHCC LONG TRADE 11-06-2025CHCC long trade
We're issuing a buy call for CHCC (PSX) based on its promising technical setup. Here's a brief overview:
- *Breakout and Correction:* CHCC broke out of its accumulation phase in October 2024, posting a high of 318. Since then, it has been in a downward corrective channel, which appears to be a bull flag based on price action analysis.
- *Breakout and Current Setup:* The stock has been gearing up for a breakout above this bull flag, supported by sufficient volume distribution. The breakout occurred today, and we expect the uptrend to continue.
🚨 TECHNICAL BUY CALL – CHCC🚨
- Buy levels:
- Buy 1: Current level (285)
- Buy 2: 271
- Buy 3: 260
- Targets:
- TP1: 312
- TP2: 335
- Long-term TP1: 364
- Long-term TP2: 392
- Long-term TP3: 422
- Stop Loss: Below 250
- Risk Reward Ratio: Greater than 4.86
This is a short-term buy trade and long-term investment call. We expect the uptrend to continue. Keep a close eye on CHCC's price action and adjust your strategies accordingly.

PPP LONG TRADE 11-06-2025PPP LONG TRADE
- *Historical Performance:* PPP started a gradual uptrend in 2013, followed by a spike-like upturn in April 2017, reaching 135. The stock then traded in a range between 35 and 137 until the start of this year.
- *Breakout and Pullback:* PPP broke out of this long-term trading range with strong volume distribution. After the breakout, the stock experienced a slow pullback, touching the breakout level and the major gap created by the breakout spike. Recently, it has shown reversal signs upwards.
- *Current Setup:* The stock is primed for an up move.
🚨 TECHNICAL BUY CALL – PPP🚨
- Buy levels:
- Current level: 170
- 162
- 155
- Targets:
- TP1: 190
- TP2: 210
- TP3: 231
- Stop Loss: Below 125
- Risk Reward Ratio: 2.4
Caution: Please buy in 3 parts in buying range. Close at least 50% position size at TP1 and then trail SL to avoid losing incurred profits in case of unforeseen market conditions.
PLEASE BOOST AND SHARE THE IDEA IF YOU FIND IT HELPFUL.

PPL LONG TRADE (11-06-2025)PPL LONG TRADE
- *Trend Breakdown and Reversal:* PPL previously followed a trend supported by a dotted blue trend line but broke down in the first week of April. It found support at a major trend line around 127 and reversed sharply upwards in a spike fashion, reaching 175.
- *Current Setup:* After a brief pullback, PPL has resumed its upward drive. The upward reversal has formed an inverted head and shoulder pattern, indicating a potential bullish trend. The stock has created multiple small IFDs and FVGs on the lower timeframe (LTF), and the volume gradient supports the continuation of this uptrend.
🚨 TECHNICAL BUY CALL – PPL🚨
- Buy levels:
- Current level: 174
- 170
- 166
- Targets (calculated using Quantified Displacement Method):
- TP1: 190
- TP2: 210
- TP3: 224
- Stop Loss: Below 154
- Risk Reward Ratio: 3
Caution: Please buy in 3 parts in buying range. Close at least 50% position size at TP1 and then trail SL to avoid losing incurred profits in case of unforeseen market conditions.
PLEASE BOOST AND SHARE THE IDEA IF YOU FIND IT HELPFUL.

MIRKS LONG TRADE 11-06-2025MIRKS LONG TRADE
- *Previous Uptrend and Correction:* MIRKS was in an uptrend until June 2023, followed by a corrective downward channel, completing three pushes down in a bearish wave.
- *Accumulation and Breakout:* Over the last year, institutions have been gradually accumulating the stock, leading to a huge breakout after a mini accumulation phase in a yellow channel (January 2025 to May 2025). The stock has made significant gains since then.
- *Current Setup:* After a brief pullback, we expect the stock to resume its upward trajectory soon.
🚨 TECHNICAL BUY CALL – MIRKS🚨
- Buy levels:
- Buy 1: 32.5
- Buy 2: 30.5
- Buy 3: 28.5
- Targets:
- TP1: 38.95
- TP2: 41.99
- TP3: 46.9
- TP4: 52.85
- Stop Loss: Below 25.3
- Risk Reward Ratio: 3
Caution: Please buy in 3 parts in buying range. Close at least 50% position size at TP1 and then trail SL to avoid losing incurred profits in case of unforeseen market conditions.
PLEASE BOOST AND SHARE THE IDEA IF YOU FIND IT HELPFUL.

BIFO LONG TRADE 11-June-2025BIFO LONG TRADE
- *Historical Performance:* BIFO remained range-bound for 8 years (Nov 2016 to Nov 2024). In December 2024, it broke out in a huge imbalance fashion, forming a spike.
- *Elliott Wave Configuration:* The price action consists of Elliot waves, with the spike being wave 3 and the latest pullback being wave 4. We expect the final upleg or wave 5 to complete the Elliot wave configuration.
🚨 TECHNICAL BUY CALL – BIFO🚨
- Buy levels:
- Current price: 179
- 162
- 150
- Targets:
- TP1: 199
- TP2: 229
- TP3: 280
- Stop Loss: Below 125 - CLOSING BASIS
- Risk Reward Ratio: 3.3
Caution: Please buy in 3 parts in buying range. Close at least 50% position size at TP1 and then trail SL to avoid losing incurred profits in case of unforeseen market conditions.
PLEASE BOOST AND SHARE THE IDEA IF YOU FIND IT HELPFUL.

Important to Sustain 326 on MOnthly basis.LUCK
Closed at 352.13 (11-06-2025)
Important to Sustain 326 on MOnthly basis.
Upside targets can be around 380 - 385.
However, it should not break 318 now.

Re-testing breakout level.FFL Closed at 16.57 (11-06-2025)
Re-testing breakout level.
Sustaining 15.20 is Important.
Upside Targets are Still Intact.

PIOC LONG TRADE (11-JUNE-2025)PIOC LONG TRADE - 1H TF
PIOC went through a prolonged consolidation phase, ending with a selling climax that touched a low of 172. The stock then rebounded sharply in an imbalanced manner and consolidated between 209 and 222 for nearly a month.
Today, PIOC broke out of this range, backed by strong bullish signals, including a bullish order block, multiple bullish FVGs, and a bullish IFD zone. These barriers are expected to prevent downward movement in the near future.
🚨 TECHNICAL BUY CALL – PIOC🚨
- Buy 1: 228
- Buy 2: 222
- Buy 3: 204-213
- Targets (calculated using Quantified Displacement Method):
- TP1: 239
- TP2: 249
- TP3: 259
- TP4: 269
- Stop Loss: Below 200 (DAILY CLOSE)
- Risk Reward Ratio: 3.3
Caution: Please buy in 3 parts in buying range. Close at least 50% position size at TP1 and then trail SL to avoid losing incurred profits in case of unforeseen market conditions.
PLEASE BOOST AND SHARE THE IDEA IF YOU FIND IT HELPFUL.

KOSM LONG TRADE (SECOND STRIKE) 11-06-2025KOSM LONG TRADE - SECOND STRIKE
We're issuing a second strike call for KOSM (PSX) based on its promising technical setup. Previously, we noted that KOSM had been trading in a downward channel since December last year. After breaking down in the previous month, it experienced a selling climax but quickly reversed, returning to the channel.
Recent signs indicate a potential new uptrend, driven by positive volume distribution and price action. The reversal has formed an inverted head and shoulder pattern, suggesting a bullish outlook.
🚨 TECHNICAL BUY CALL – KOSM🚨
Buy 1 - Current level: 5.64
Buy 2 - 5.4
Buy 3 - 5.2
- TP1: 5.99
- TP2: 6.5
- TP3: 7
- Long-term TP1: 7.6
- Long-term TP2: 8.2
- Stop Loss: Below 4.6 (Day closing basis)
- Risk Reward Ratio: 1:5
Caution: Please buy in 3 parts in buying range. Close at least 50% position size at TP1 and then trail SL to avoid losing incurred profits in case of unforeseen market conditions.
PLEASE BOOST AND SHARE THE IDEA IF YOU FIND IT HELPFUL.

GCIL | Swing Trade Setup!!!GCIL's current price action indicates a favorable technical setup.
Key observations include:
Uptrend indication: The stock price is trading above the 200-day EMA, suggesting an overall uptrend.
Fibonacci retracement: A fake breakout was observed on April 3rd, which coincided with a 61.8% retracement level from the low of 8.82 (October 4th, 2024) to the high of 23.50 (March 3rd, 2025). The stock has since appreciated by 9.10%.
MACD crossover: The MACD indicator is exhibiting a bullish crossover from its bottom, signaling a potential reversal and strengthening of the uptrend.
Trading Strategy
Based on the technical analysis, a long position can be considered at the support level of 16.16. To manage risk, a strict stop-loss is recommended at 14.40. Potential targets for the trade are:
Target 1: 17.89, representing a 10.71% upside
Target 2: 20, representing a 23.76% upside

Trade Setup with Multi-Stage Target LevelsThe stock experienced a sharp upward movement, breaking out from a long consolidation phase and reaching a high near PKR 278. Currently, it has pulled back to PKR 235. The chart outlines a trading plan with multiple levels: the first entry point around PKR 226, and a second entry around PKR 210, indicating potential accumulation zones for traders. The initial target is set at PKR 245, the mid-term target at PKR 278, and the final target at PKR 314. The projected paths suggest two scenarios: either a bounce from current levels or a deeper pullback before resuming the uptrend. Volume spikes during the breakout phase suggest strong buying interest. Overall, the chart indicates a bullish outlook with clear risk management levels for potential entries and profit-taking.

FFL Next Buying Zone in Daily Chart FFL Next Buying Zone in Daily Chart
buying Zone 15.21 to 15.60.
This is for educational purpose. Do your own research for any financial investments.

OGDC PROBABLY IN WAVE ' B ' OR ' 5 ' - LONGOGDC is most probably in wave B or 5
Currently the price is forming a flag pattern as minor wave b or 2 which might continue to build this week. As per our preferred wave count we are only looking to buy OGDC once it breaks above the flag formation.
Last minor swing high is at 213.50 at the moment therefore we will enter at 213.60, however as the pattern might continue to build it can make new swing low and high therefore if the flag pattern stays intact then we will use the next minor swing high for entry accordingly.
Currently we are targeting 235 area, however if the pattern continues to build we will modify the target as well.
Alternately, if the prices go down and breaks the flag pattern this trade setup will get invalid
Let see how this plays, Good Luck!
Disclaimer: The information presented in this wave analysis is intended solely for educational and informational purposes. It does not constitute financial or trading advice, nor should it be interpreted as a recommendation to buy or sell any securities.

SPWL LONG TRADE (10-06-2025)SPWL LONG TRADE
On the daily timeframe, SPWL has been in a downtrend for a long time but has been consolidating in a trading range between PKR 11.5 and PKR 14.2 since October 2024. After an unsuccessful attempt to break above the range, the stock experienced a selling climax in the first and second week of May, which led to a sharp decline.
However, the stock reversed sharply upwards after the selling climax and returned to the trading range, consolidating for about a month. Indications now suggest that this consolidation is taking shape of an upward leg, supported by increasing volumes gearing up for an upward move.
During the recent upward movement, the stock created an Institutional Demand Zone (IFDZ), multiple bullish Fair Value Gaps (FVGs), and a bullish order block on lower timeframes.
🚨 TECHNICAL BUY CALL – SPWL🚨
1. Current level: PKR 12.1
2. PKR 11.9
3. PKR 11.8
1. TP1: PKR 12.3
2. TP2: PKR 12.7
3. TP3: PKR 13.1
*Stop Loss:* Below PKR 11.5
*Risk-Reward Ratio:* 2.8
Caution: Please buy in 3 parts in buying range. Close at least 50% position size at TP1 and then trail SL to avoid losing incurred profits in case of unforeseen market conditions.
PLEASE BOOST AND SHARE THE IDEA IF YOU FIND IT HELPFUL.

LSECL LONG TRADE 10-June-2025LSECL LONG TRADE
LSECL listed on PSX in June 2024, has shown significant movement since then. After consolidating in a SCALOP formation, the stock gave a breakout in December 2024. It reached a higher high of PKR 7.47 before entering a corrective phase within a yellow channel.
The stock price is currently moving within a larger, upward-slanting channel marked in light blue. After giving a selling climax and exiting the corrective yellow channel, the price took support at PKR 3.9, re-entered the channel, and continued upwards, breaking out with volume gradient support.
🚨 TECHNICAL BUY CALL – LSECL🚨
- *Buying Level 1*: PKR 5.56 (current level)
- *Buying Level 2*: PKR 5.26
- *Buying Level 3*: PKR 5.01
Target Prices
- *TP1*: PKR 6.22
- *TP2*: PKR 6.68
- *TP3*: PKR 7.4
Stop Loss below PKR 4.6 (Daily Close)
Risk-reward ratio of 3.3.
Caution: Please buy in 3 parts in buying range. Close at least 50% position size at TP1 and then trail SL to avoid losing incurred profits in case of unforeseen market conditions.
PLEASE BOOST AND SHARE THE IDEA IF YOU FIND IT HELPFUL.

TPLT LONG TRADE 10-June-2025TPLT LONG TRADE
On the 1H timeframe, TPLT has been trending in a downward channel since December last year. Recently, the stock broke out of this channel, forming an inverted head and shoulders pattern. Today, the price broke out above the neckline of this pattern.
During its breakout, TPLT created multiple fair value gaps, new order blocks, and flipped institutional demand zones, all indicating a powerful reversal. The volume spread analysis also supports the continuation of this upward reversal. We expect the price to continue its upward reversal and achieve targets based on measured moves.
🚨 TECHNICAL BUY CALL – TPLT🚨
1. Current level: PKR 7.51
2. PKR 7.35
3. PKR 6.8
TP1: PKR 8.4
TP2: PKR 9.5
TP3: PKR 10.4
*Stop Loss:* Below PKR 6.2
*Risk-Reward Ratio:* 3.25
Caution: Please buy in 3 parts in buying range. Close at least 50% position size at TP1 and then trail SL to avoid losing incurred profits in case of unforeseen market conditions.
PLEASE BOOST AND SHARE THE IDEA IF YOU FIND IT HELPFUL.

GLAXO LONG TRADE 10-June-2025GLAXO LONG TRADE
Glaxo has shown significant movement on the 1D timeframe. After consolidating in a yellow channel, the stock broke out powerfully with an imbalance, completing the first wave at around PKR 442. It then entered a complex correction phase, forming a hybrid pattern consisting of a blue channel and a diverging channel (megaphone pattern).
Recently, the stock experienced a selling climax from mid-April to the first week of May, with its price falling to PKR 300. However, it quickly re-entered the consolidating blue channel. Volume distribution analysis indicates more buyers than sellers, suggesting an upward trend.
🚨 TECHNICAL BUY CALL – GLAXO🚨
- *Buying Level 1*: PKR 391 (current price)
- *Buying Level 2*: PKR 378
- *Buying Level 3*: PKR 360
- *TP1*: PKR 417
- *TP2*: PKR 459.6
- *TP3*: PKR 502
Stop loss below PKR 350.
Risk-reward ratio of 3.3
Caution: Please buy in 3 parts in buying range. Close at least 50% position size at TP1 and then trail SL to avoid losing incurred profits in case of unforeseen market conditions.
PLEASE BOOST AND SHARE THE IDEA IF YOU FIND IT HELPFUL.

BGL LONG TRADE SECOND STRIKE 10-06-2025BGL LONG TRADE 10-06-2025
As previously shared, BGL has been in an uptrend from April 2024 to May 2024, characterized by a spike phase followed by a corrective channel. Recently, the stock gave a liquidity sweep by springing below a major trend line, as marked on the charts, and sharply reversed upwards.
The volume distribution supports this upward move, which is expected to sustain further. The stock has created a flipped institutional demand zone, acting as a barrier to prevent downward movement. Additionally, several imbalances or measuring gaps have been created, which will act as rebounding levels.
TECHNICAL BUY CALL - BGL
1. BUY1 : Current level: PKR 11.8
2. BUY 2: PKR 11.3
3. BUY3 :PKR 10.9
1. TP1: PKR 12.5
2. TP2: PKR 13.4
3. TP3: PKR 15.4
*Stop Loss:* Below PKR 9.9
*Risk-Reward Ratio:* 4.6
Book 50% Profit on T1 and move your SL to avoid losing profits due to market volatility.

AGP LONG TRADE 10-June-2025AGP LONG TRADE
We've analyzed AGP on both 1D and 1H timeframes. On the daily chart, the stock previously formed a scallop formation and broke out around PKR 147 in November last year. Following the breakout, the stock entered an upward channel pattern.
On the 1H chart, AGP recently gave a selling climax and fell below the uptrend channel, but quickly reversed, forming multiple measuring gaps and flipping an institutional demand zone. With sufficient volume distribution supporting the uptrend, we see potential upside and continuation of the uptrend.
TECHNICAL BUY CALL-AGP
1. Current level: PKR 199.99
2. PKR 195
3. PKR 190
1. TP1: PKR 205
2. TP2: PKR 225
3. TP3: PKR 244
*Stop Loss:* Below PKR 180
*Risk-Reward Ratio:* 4.31
Buy in 3 levels and book 50% Profit on TP1 and trail your SL.

BFBIO Analysis1- Price has been struggling to breakout previous HL since 22nd May
but went vain to date. Which show lack of interest from buyers.
2- Candles with upper wicks and RSI is taking resistance from 60
level on hourly is evident that price will retrace further.
3- Bearish divergence on daily confirming is also confirming the
retracement will proceed. The price may retrace in between
152~192 to form a right shoulder before and impulsive move or
else price need to break and retest the previous LH area to
confirm an impulsive move to start.
4- Keep monitoring for both above mentioned scenarios.

AGSML - BREAKOUT TARGETING 8.50 -11.00, FOLLOWED BY 13.50 - 16.5📈 AGSML (Abdullah Shah Ghazi Sugar Mills Ltd) – Technical Analysis
AGSML has confirmed a breakout from its long-term downtrend line after a prolonged accumulation phase around the PKR 4.5–6.5 range. The stock closed at PKR 7.00, gaining +18.64%, and is now positioned above key Fibonacci retracement levels — signaling a potential trend reversal.
With this breakout, immediate upside targets lie at PKR 8.49, followed by PKR 9.40–10.95 in the short to medium term. A strong move beyond these zones could extend the rally toward PKR 13.50–16.50, based on historical Fibonacci projections.
As long as the price holds above the 6.50–6.90 breakout zone, AGSML appears technically poised for a sustained upward move.
📌 Disclaimer:
This is a technical analysis-based trade idea for educational and informational purposes only. It does not constitute financial advice. Please do your own research (DYOR) and consult your financial advisor before making any investment decisions. Trading involves risk, and past performance is not indicative of future results.

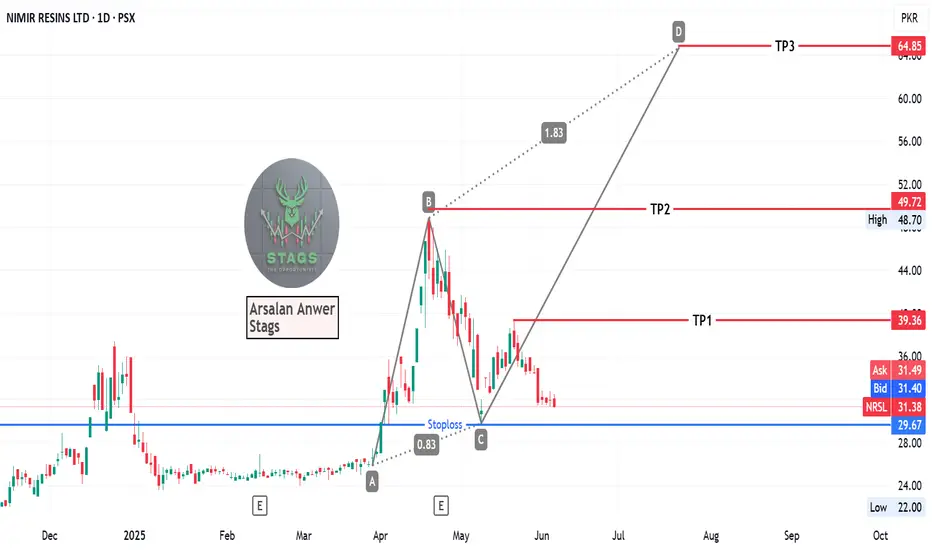
NRSL, 1D, ABCD Pattern, PSX, LongNRSL after hitting the 1st Leg now in consolidation phase.
Enter trade with current rate and SL closing below 29
TP1: 39
TP2: 49
TP3: 64