BOP LONG TRADE 05-06-2025BOP LONG TRADE
BOP has been in an uptrend since June 2024, completing an impulsive 5-wave structure (waves 1-2-3-4-5). Following the uptrend, the stock entered a distribution phase, which was then followed by a corrective channel (marked in pink) consisting of 3 pushes down (A-B-C correction).
After completing the corrective channel, BOP has been in an absorption phase since the first week of May. Notably, the stock has shown signs of a valid breakout, supported by:
- Volume distribution analysis
- Price moving above EMA
- Breakout from the corrective channel
🚨 TECHNICAL BUY CALL –BOP🚨
- BUY1: 10.25 (current level)
- BUY2: 10.00
- BUY3: 9.80
- TP1: PKR 11.00
- TP2: PKR 11.96
- TP3: PKR 12.48
- TP4: PKR 12.96
STOP LOSS: Below 9.10 (CLOSING BASIS)
RISK-REWARD: 1:3
Caution: Close at least 50% position size at TP1 and then trail SL to avoid losing incurred profits in case of unforeseen market conditions.
PLEASE BOOST AND SHARE THE IDEA IF YOU FIND IT HELPFUL.

Bullish Divergence
Closed at 26.89 (05-06-2025)
27.50 - 28 is an Immediate Important
Resistance that needs to cross & sustain
for further upside.
There is a Bullish Divergence which may
help this time to break the resistance.
But better approach would be to wait
for the Resistance to cross & then take entry.
If it does, 32 - 33 is easily reachable.
On the flip side, it should not break 23.50
otherwise there would be more selling pressure.

KML LONG TRADE 02-06-2025📊 KML LONG TRADE (Wyckoff-Based Setup)
KML has been following the Wyckoff Transition Phases impressively since 2021 — moving through Accumulation → Distribution → Corrective Channel → Breakout → Re-Accumulation.
✅ Currently showing signs of being ready for the next up-leg, supported by positive Volume Distribution.
✅ Price is trading above EMA-20, adding to bullish confluence.
🚀 Structure is bullish — watch for momentum to pick up. Breakout continuation likely.
🚨 TECHNICAL BUY CALL – KML🚨
BUY1: 37.55
BUY2: 35.5
BUY3: 33.5
📈 TP1 : Rs. 38.8
📈 TP2 : Rs. 45
📈 TP2 : Rs. 54.5
🛑 STOP LOSS: BELOW Rs. 26 (Daily Close)
📊 RISK-REWARD: 1:3
Caution: Close at least 50% position size at TP1 and then trail SL to avoid losing incurred profits in case of unforeseen market conditions.
PLEASE BOOST AND SHARE THE IDEA IF YOU FIND IT HELPFUL.

KSBP Technical Update: Bullish Structure - What's Next? KSBP has demonstrated strong performance over the past trading month.
From a broader perspective, the stock had been in a Wyckoff Accumulation phase since late 2021, with all key transitional phases and events clearly identifiable on the chart. Throughout this period, it consistently formed higher highs and higher lows, gradually progressing in an upward trend and eventually breaking out of the accumulation zone.
Currently, KSBP appears to be retesting the breakout level, potentially setting the stage for the next leg up.
Buying and Profit Taking Levels are same as shared previously - Just keep SL revised Level as 200.
🛑 STOP LOSS: BELOW Rs. 200 (Daily Close)
PLEASE BOOST AND SHARE THE IDEA IF YOU FIND IT HELPFUL.

TREET LONG TRADE 02-06-2025TREET LONG TRADE
TREET bounced off its major trendline support in October 2024 and rallied to a high of 29.33. Since then, it has been in a downward corrective channel, forming a classic bull flag pattern. A SPRG (spring/reversal) has occurred, backed by a positive volume gradient, signaling a potential upside move.
The stock has been consolidating at current levels for the past two weeks, but volume distribution suggests accumulation and we can see a breakout in today’s candle. Price is currently trading above the EMA-20, reinforcing short-term bullish momentum.
🚨 TECHNICAL BUY CALL – TREET🚨
BUY1: 19.83
BUY2: 19.5
BUY3: 19.22
📈 TP1 : Rs. 22.5
📈 TP2 : Rs. 25.25
🛑 STOP LOSS: BELOW Rs. 18 (Daily Close)
📊 RISK-REWARD: 1:6
Caution: Close at least 50% position size at TP1 and then trail SL to avoid losing incurred profits in case of unforeseen market conditions.


DWAE BULLISH MARUBOZU WITH STRONG BREAKOUT TG: 48 -57, 75 - 84📈 DWAE (Dewan Automotive Engineering Ltd) - TECHNICAL VIEW
Dewan Automotive Engineering Ltd (PSX: DWAE) has delivered a decisive breakout from a long-standing falling wedge pattern, accompanied by a powerful bullish marubozu candle on the weekly chart. The stock surged by +34.01%, closing at PKR 34.44, signaling the potential start of a new uptrend after an extended consolidation phase.
The falling wedge, a classic bullish reversal formation, had been compressing price action for several months. The current breakout, confirmed by increased volume and a strong weekly close above the wedge resistance, marks a shift in momentum from distribution to accumulation.
From a technical standpoint, the immediate initial target lies in the PKR 48–57 range—roughly the 50% retracement zone of the previous decline. A sustained move above this range would open the door toward the broader breakout objective of PKR 75–84, offering significant upside potential.
To maintain this bullish outlook, DWAE must hold above the breakout zone near PKR 28–30, which now acts as strong structural support. Any consolidation above this level would be viewed as a healthy retest and continuation setup.
In summary, DWAE has initiated a high-probability breakout from a classic wedge pattern, supported by a bullish candlestick structure and rising volume. As long as it holds above key support, the stock is well-positioned to advance toward PKR 48–57, with an extended target of PKR 75–84 in the coming weeks.

Inverse Head & Shoulders Forming – Watch for Breakout Above 28UNITY indicates the formation of an inverse head and shoulders pattern, a bullish reversal setup. The neckline resistance is drawn around the PKR 27.5–28 level, which also aligns closely with the 200-day EMA at PKR 28.23, adding to its significance. Volume has notably increased during the formation of the right shoulder, suggesting growing bullish interest. A long position should only be considered after a decisive breakout above the neckline resistance , ideally on strong volume, confirming the pattern. If the breakout occurs, the projected upside target could extend toward the PKR 34–35 range, which is a previous major resistance zone. Until then, the setup remains neutral and unconfirmed.

Currently at Strong Resistance level.TREET closed at 19.53 (23-05-25)
Currently at Strong Resistance level.
However, Weekly closing above 19.50 would
be a positive sign and we may see upside
around 21 - 21.30 & then 23.
Very Important Support lies around 17.50
& then around 14.50; however that would be
a very crucial level as breaking 14.50 would
trigger more selling pressure.

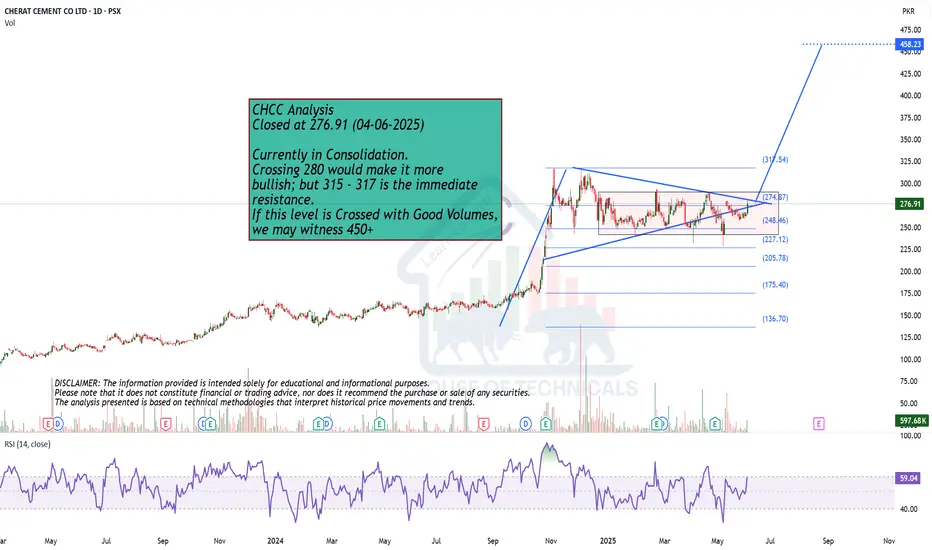
Currently in Consolidation.
Closed at 276.91 (04-06-2025)
Currently in Consolidation.
Crossing 280 would make it more
bullish; but 315 - 317 is the immediate
resistance.
If this level is Crossed with Good Volumes,
we may witness 450+
Making HH HL.
Closed at 40.45 (04-06-2025)
Making HH HL.
Bearish Divergence played well &
dragged the price from 44 - 45 to around 33.
Printed HL & started moving upside.
If 45 is Crossed & Sustained, we may witness
new Highs around 55 - 57.
However this time, Stoploss should be 33.50
on Closing basis.

Inverse H&S pattern.Closed at 16.75 (04-06-2025)
Inverse H&S pattern.
Sustaining 16.45 may lead it
towards 18.70 - 19 initially
& then 20.50 - 21.50
Stoploss is Must!

FABL BREAKOUT AND BEYOND BUY CALLPreviously FABL completed Elliot Waves 1-2-3-4-5 of uptrend and marked a high of 58.
It went into retracement and completed the corrective Waves A-B-C, reaching to Fib ratio of 50% and price of Rs 39.
This corrective wave pattern along with Spike of Wave 5 of previous Uptrend makes a Bull Edge Flag symbolizing Wyckoff Re-accumulation phase.
FABL has now broke out of this Bullish Formation with Dynamic Volume Spread and Price Action showing both momentum which will last for more rise.
TECHNICAL BUY CALL –FABL
BUY1: 59.1(CP)
BUY2: 55.2(PB)
BUY3: 52.2(PB)
TP1 : Rs. 69.9
TP2 : Rs. 74.1
TP3 : Rs. 78.1
STOP LOSS: BELOW Rs. 47.5(Daily Close)
RISK-REWARD: 1:4.9
Caution: Close at least 50% position size at TP1 and then trail SL to avoid losing incurred profits in case of unforeseen market conditions.
PLEASE BOOST AND SHARE THE IDEA IF YOU FIND IT HELPFUL.

HBL HIGH REWARD LONG TRADE HBL has been trending in classical Stair Step Uptrend since months.
It posted a recent high of 184 and went in Downward Corrective Channel.
This Corrective Leg and preceding Spike form what is called a Wedge Bull Flag.
Price gave three required pushes in the downward wedge and broke with required momentum in the shape of Volume Gradient and Trending Bull Candles.
On this wedge Bull Flag Breakout Price has also formed IFDZ and measuring gaps which forms a barrier against downward move because of interests of already invested Smart Money.
These lower levels are thus safe and protected, making it highly potent place for Long entry.
Volume Distribution, Price Action and Location of Price with respect to 20EMA are all supportive of a potential long setup.
TECHNICAL BUY CALL –HBL
BUY1: 164
BUY2: 160
BUY3: 156
TP1 : Rs. 174
TP2 : Rs. 184
TP3 : Rs. 196
TP3 : Rs. 209
STOP LOSS: BELOW Rs. 150 (Daily Close)
RISK-REWARD: 1:6.5
Caution: Close at least 50% position size at TP1 and then trail SL to avoid losing incurred profits in case of unforeseen market conditions.
PLEASE BOOST AND SHARE THE IDEA IF YOU FIND IT HELPFUL.

ICL LONG TRADEICL has been going through TYPICAL CLASSICAL STAIR STEP UTREND, which in in fact is combo of Impulses and accumulations resulting in measured moves as per Principles of Price Action.
After latest Wyckoff Accumulation Phase and all corresponding events, it has broken out.
It is pulling back after posting a high of 92 in Spike phase of the new uptrend.
This pullback is expected to be shallow and end after High 1.
Volume Distribution, Price Action and Location of Price with respect to 20EMA are all supportive of a potential long setup.
TECHNICAL BUY/INVESTMENT CALL 1D –ICL
BUY1: 82.1
BUY2: 78.3
BUY3: 76.3
TP1 : Rs. 88.2
TP2 : Rs. 92.4
TP3 : Rs. 101.00
STOP LOSS: BELOW Rs. 73.00 (Daily Close)
RISK-REWARD: 1:3
Caution: Close at least 50% position size at TP1 and then trail SL to avoid losing incurred profits in case of unforeseen market conditions.
PLEASE BOOST AND SHARE THE IDEA IF YOU FIND IT HELPFUL.

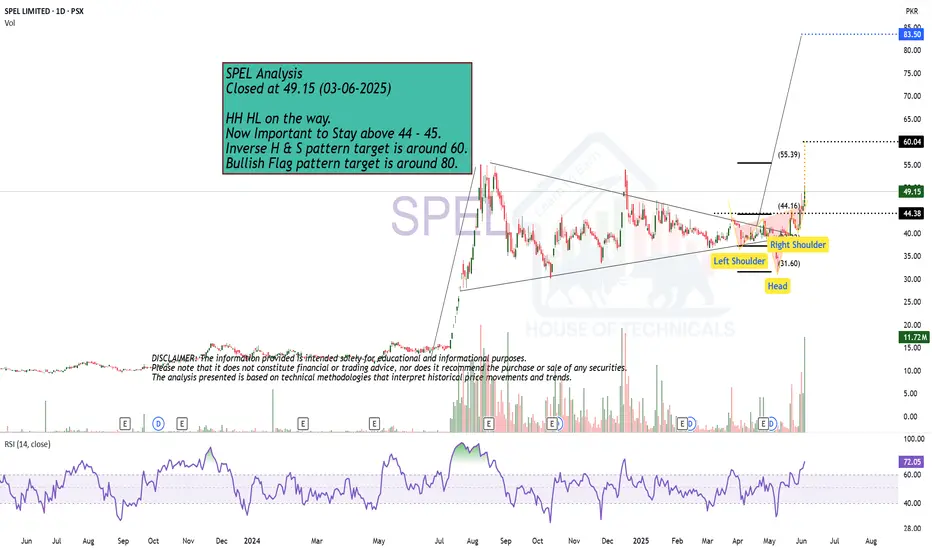
HH HL on the way.
Closed at 49.15 (03-06-2025)
HH HL on the way.
Now Important to Stay above 44 - 45.
Inverse H & S pattern target is around 60.
Bullish Flag pattern target is around 80.
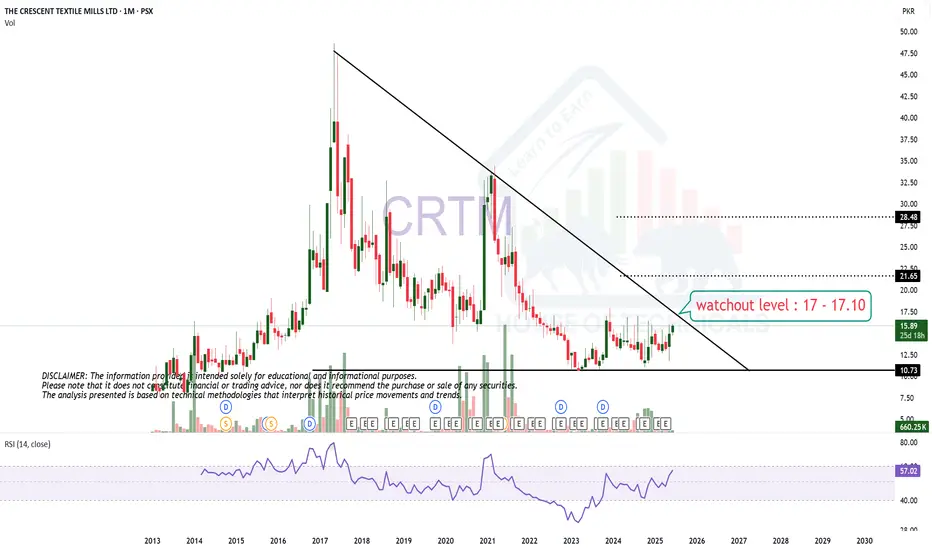
Watchout LevelWatch out level for CRTM is around 17 - 17.10 which is actually a Strong Resistance point.
Crossing & Sustaining this level will lead it towards 21 initially.
KAPCO LONG TRADE ON 3HPreviously KAPCO was in Downtrend as depicted on charts. Its transition from Downtrend to Reversal Formation to Wyckoff Re accumulation phase, Breakout and its Re-test have all been marked on charts to help you make an educated trade
Volume Distribution, Price Action and Location of Price with respect to 20EMA are all supportive of a potential long setup.
TECHNICAL BUY/INVESTMENT CALL 3H –KAPCO
BUY1: 33.70
BUY2: 32.80
BUY3: 31.50
TP1 : Rs. 34.80
TP2 : Rs. 37.70
TP3 : Rs. 40.00
STOP LOSS: BELOW Rs. 30.00 (Daily Close)
RISK-REWARD: 1:4.9
Caution: Close at least 50% position size at TP1 and then trail SL to avoid losing incurred profits in case of unforeseen market conditions.
PLEASE BOOST AND SHARE THE IDEA IF YOU FIND IT HELPFUL.

AKDSL LONG TRADE ON 1WPreviously AKDSL completed Elliot Waves 1-2-3-4-5 of uptrend on 1W TF, then it retraced and completed its corrective waves A-B-C to the Golden Fib ratio.
It started new uptrend since Jul 2024. It completed Wave 1 and 2 which coincidentally taken the form of Inverted Head and Shoulders Pattern. This also constitutes the beginning of Wave 3 of Uptrend
It has broken out of H&S Bullish formation and formed an IFDZ which is a very safe place to enter a long trade.
While chart patterns alone are not always reliable without confirmation, in this case, the Volume Distribution and Price Action which previously displayed a spike, support the breakout, indicating genuine buying interest by institutions behind the move.
TECHNICAL BUY/INVESTMENT CALL 1W –AKDSL
BUY1: 27.24
BUY2: 26.50
BUY3: 25.5
TP1 : Rs. 29.80
TP2 : Rs. 33.20
TP3 : Rs. 37.2
STOP LOSS: BELOW Rs. 23.2(Daily Close)
RISK-REWARD: 1:5.4
Caution: Close at least 50% position size at TP1 and then trail SL to avoid losing incurred profits in case of unforeseen market conditions.
PLEASE BOOST AND SHARE THE IDEA IF YOU FIND IT HELPFUL.

FFL LONG/INVESTMENT TRADE- AT CORRECT TIMEFFL has recently broken out of a Double Bottom Bull Flag pattern, signaling renewed bullish momentum. When viewed in the broader context, the chart structure also reveals a Cup and Handle formation—a widely recognized bullish pattern.
While chart patterns alone are not always reliable without confirmation, in this case, the Volume Distribution, Wave Analysis and Price Action which previously displayed a spike, support the breakout, indicating genuine buying interest by institutions behind the move.
The breakout from the DB Bull Flag is already in play, and the stock now appears to be positioning for attaining several measured move targets. Additionally, the 20-day EMA is trending upward, lending further support to a potential long setup.
TECHNICAL BUY/INVESTMENT CALL 1W –FFL
BUY1: 16.75
BUY2: 15.75
BUY3: 14.75
TP1 : Rs. 19.80
TP2 : Rs. 22.70
TP3 : Rs. 25.30
INV TP1 : Rs. 28.50
INV TP2: Rs. 31.90
STOP LOSS: BELOW Rs. 14.00 (Daily Close)
RISK-REWARD: 1:5+
Caution: Close at least 30% position size at TP1 and then trail SL to avoid losing incurred profits in case of unforeseen market conditions.
PLEASE BOOST AND SHARE THE IDEA IF YOU FIND IT HELPFUL.

FFC LONG/INVESTMENT TRADE- AT CORRECT TIMEFFL has recently broken out of a Double Bottom Bull Flag pattern, signaling renewed bullish momentum. When viewed in the broader context, the chart structure also reveals a Cup and Handle formation—a widely recognized bullish pattern.
While chart patterns alone are not always reliable without confirmation, in this case, the Volume Distribution, Wave Analysis and Price Action which previously displayed a spike, support the breakout, indicating genuine buying interest by institutions behind the move.
The breakout from the DB Bull Flag is already in play, and the stock now appears to be positioning for attaining several measured move targets. Additionally, the 20-day EMA is trending upward, lending further support to a potential long setup.
TECHNICAL BUY/INVESTMENT CALL 1W –FFL
BUY1: 16.75
BUY2: 15.75
BUY3: 14.75
TP1 : Rs. 19.80
TP2 : Rs. 22.70
TP3 : Rs. 25.30
INV TP1 : Rs. 28.50
INV TP2: Rs. 31.90
STOP LOSS: BELOW Rs. 14.00 (Daily Close)
RISK-REWARD: 1:5+
Caution: Close at least 30% position size at TP1 and then trail SL to avoid losing incurred profits in case of unforeseen market conditions.
PLEASE BOOST AND SHARE THE IDEA IF YOU FIND IT HELPFUL.

FEROZ LONG (SECOND STRIKE TRADE) 02-06-2025FEROZ LONG TRADE was shared here. ()
FEROZ has resumed its upward trajectory after a healthy correction from its December 2024 high of Rs. 393, retracing close to the 61.8% Fibonacci level — a key support zone.
Bullish technical confirmation:
• Price closed above the 20-Day EMA, signaling short-term strength.
• Higher Low formation, indicating potential trend reversal.
• Increased volumes on the recent up-move, suggesting strong accumulation.
With technical indicators aligning positively, a fresh uptrend appears to be in play. Buy on dips or at CMP for potential upside towards previous highs.
It Hit TP1 and took a pull back. We gave a rebuy call on group during live market hours. Its again in second Pull Back after Targeting 350 (TP1++).
Sharing Second Strike Call.
🚨 TECHNICAL BUY CALL – FEROZ🚨
BUY1: 330-335
BUY2: 322
BUY3: 311
📈 TP1 : Rs. 350
📈 TP2 : Rs. 380
🛑 STOP LOSS: BELOW Rs. 270 (Daily Close)
📊 RISK-REWARD: 1:1.8 (Medium)
Caution: Close at least 50% position size at TP1 and then trail SL to avoid losing incurred profits in case of unforeseen market conditions.
PLEASE BOOST AND SHARE THE IDEA IF YOU FIND IT HELPFUL.

DOL LONG TRADE (SECOND STRIKE)DOL LONG TRADE (SECOND STRIKE)
DOL has been in Uptrend since Jul 2022, it spent around two years in Re-Accumulation phase.
It broke out of this Re-Accumulation Zone in Dec 2024.
It re-tested this Breakout in Multiple Bottom Pattern since then.
It has now broke out of this Re-Test Zone in Spike Pattern creating multiple Fair Value gaps on the way. Now it is pulling back towards the FVGs and it is expected to bounce back upwards and achieve its revised targets.
🚨 TECHNICAL BUY CALL – DOL🚨
BUY ZONE: 29.4-27.7
📈 TP1 : Rs. 33.88
📈 TP2 : Rs. 37.32
🛑 STOP LOSS: BELOW Rs. 26.8 (Daily Close)
📊 RISK-REWARD: 1:2.9
Caution: Please buy in 3 parts in buying range. Close at least 50% position size at TP1 and then trail SL to avoid losing incurred profits in case of unforeseen market conditions.
PLEASE BOOST AND SHARE THE IDEA IF YOU FIND IT HELPFUL.
