ASL LONG TRADE (SECOND STRIKE)ASL LONG TRADE (SECOND STRIKE)
ASL remained in a Wyckoff Accumulation Phase for nearly a year before breaking out in December 2024, reaching a high of 13.42. This was followed by a corrective downward channel. Recently, the stock has completed key structural milestones, including a Test of Breakout (TOB), a reversal, the formation of a Higher Low (HL), and a breakout from the corrective channel.
Currently, it appears to be in its second pullback, offering a potential re-entry opportunity within the broader continuation structure.
🚨 TECHNICAL BUY CALL – ASL 🚨
BUY ZONE: 11.35-10.94 in three parts
📈 TP1 : Rs. 12.85
📈 TP2 : Rs. 13.75
📈 TP3 : Rs. 15.73
🛑 STOP LOSS: BELOW Rs. 9.7 (Daily Close)
📊 RISK-REWARD: 1:3.9+
Caution: Close at least 50% position size at TP1 and then trail SL to avoid losing incurred profits in case of unforeseen market conditions.
PLEASE BOOST AND SHARE THE IDEA IF YOU FIND IT HELPFUL.

AGIL LONG TRADE/INVESTMENT CALL 03-06-2025AGIL – Technical Buy Setup (Wyckoff Transition Breakout)
AGIL has successfully transitioned through the Wyckoff Phases — from Accumulation, into a Spike, and then forming a Channel/Triangle structure. The recent breakout from this channel, confirmed by a positive volume gradient, indicates bullish continuation. Price is currently trading above the 20-EMA, reinforcing momentum strength.
Entry Plan (Scale-In):
Buy 1: Rs. 120-126
Buy 2: Rs. 100
🎯 Targets:
TP1: Rs. 138
TP2: Rs. 152.9
TP3: Rs. 163.9
🛑 Stop Loss: Below Rs. 90(Daily Close)
📊 Risk-Reward: 1:4+
⚠️ Risk Management: Close at least 50% at TP1 and trail SL to protect profits in case of unexpected volatility.

NATF LONG TRADENATF was trading within an ascending channel and recently rebounded from the channel's lower boundary. Simultaneously, it had been forming a Head & Shoulders pattern on the side, from which it has now broken out to the upside. Price action is also holding above the EMA-20. These three confluences—channel support, H&S breakout, and EMA-20 support—combined with favorable volume distribution, created a strong setup for a potential explosive continuation (ERC) move to the upside.
🚨 TECHNICAL BUY CALL – NATF🚨
BUY ZONE: 265-240 in three parts
📈 TP1 : Rs. 276
📈 TP2 : Rs. 289
📈 TP3 : Rs. 298
🛑 STOP LOSS: BELOW Rs. 228 (Daily Close)
📊 RISK-REWARD: 1:4.55
Caution: Close at least 50% position size at TP1 and then trail SL to avoid losing incurred profits in case of unforeseen market conditions.
PLEASE BOOST AND SHARE THE IDEA IF YOU FIND IT HELPFUL.

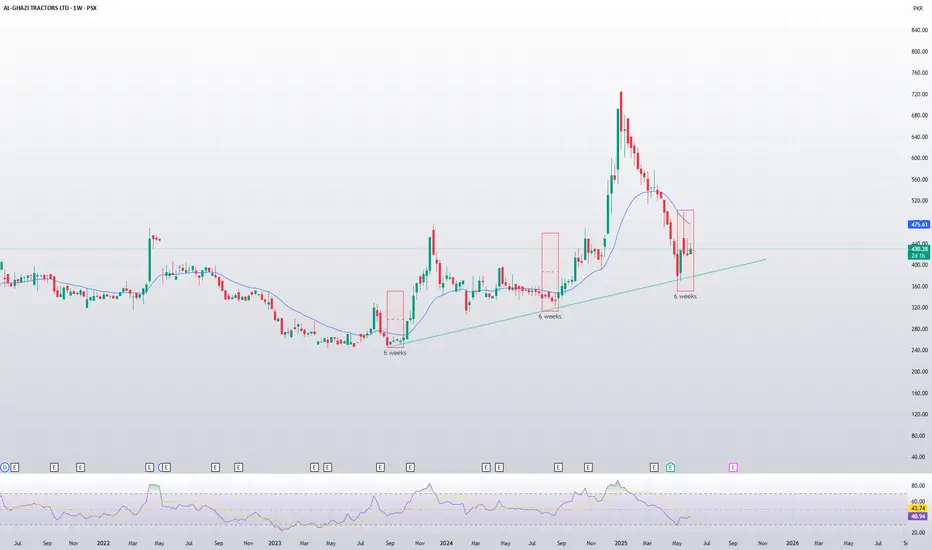
AGTL Weekly Chart Analysis (PSX: AGTL)🟢 Consistent Bullish Reaction from Trendline Support
Trendline Support: Price is respecting a strong ascending trendline that has been tested multiple times since 2023.
Key Observation:
Each time price touches the trendline, it consolidates for exactly 6 weeks.
After this 6-week consolidation, AGTL typically enters a strong bullish rally.
🔁 Repeating 6-Week Pattern
First Zone: October 2023 — 6-week base → breakout rally.
Second Zone: July 2024 — again 6-week accumulation → bullish trend resumes.
Current Zone: May 2025 — AGTL touched the trendline again and has completed another 6-week base.
This is the third time this exact behavior is repeating, indicating a strong fractal pattern and high probability of a new uptrend starting soon.
🔮 Bullish Outlook
If history repeats, AGTL is likely to start rallying soon, potentially leading to a new swing high over the coming weeks/months.
The 6-week cycle provides a time-based edge to anticipate movement rather than reacting late.
📌 Possible Price Projections for Bullish Trend
These are historically grounded targets based on actual previous price movements following similar trendline+consolidation patterns.
If AGTL follows the same 6-week base → rally pattern again:
Short-term target: ~670 PKR (87%)
Extended bull case: ~1030 PKR (188%)
📈 Conclusion
AGTL is showing strong technical consistency:
Each touch of the trendline has led to a 6-week accumulation followed by a bullish breakout.
TBL printing a falling Wedge TBL printing a falling Wedge, entry with a buy stop right above last Lower High. RR 1:1

GGL potential bullish setup GGL in accumulation phase expected breakout is Bullish, entry with a buy stop over the Accumulation box.

FFL | Inverse H&SFFL is forming Inverse Head and Shoulder Pattern on daily time frame, which a bullish reversal pattern, currently the stock is at neckline resistance upon break out and retest more upside towards 19.50 is expected.

Nice Setup15.30 - 15.50 important to sustain for further upside
Important Resistance is around 18 - 18.70

FABL | Growth Potential AheadAccording to its price action, FABL is currently trading within a corrective structure, with a strong support zone identified at 45, offering a strategic entry opportunity for long positions. The price is moving within a downward-sloping channel, indicating a consolidation phase, with a potential breakout towards higher levels.
Entry Zone: Around 45
Stop Loss: Below 43
TP1: 51
TP2: 54
Risk To Reward Ration = 1 : 4.50

FABL | Bullish Pennant PatternAccording to its price action, FABL is currently testing 200-day EMA and forming bullish pennant pattern which need a break out. Offering a strategic entry opportunity for long positions. On the flip side, short term resistance levels are 50.97, 53.84 and 56.21 and pennant pattern projection lies around 77. Price reversal if it breaks moving average and stop loss level is 40.

FFC LONG TRADE 03-06-2025FFC has reversed from its downward channel after a liquidity sweep by institutions, indicating a potential high-probability reversal.
The stock has retested the breakout, formed a higher low, and shows a bullish volume profile, confirming upward momentum.
A demand flip zone has formed, acting as new support and helping to limit downside.
Additional bullish signals include a bull flag pattern and price trading above the 20-day EMA, both supporting continued upside.
🚨 TECHNICAL BUY CALL –FFC🚨
BUY1: 371
BUY2: 364
BUY3: 355
TP1 : Rs. 384
TP2 : Rs. 398
TP3 : Rs. 408
STOP LOSS: BELOW Rs. 345 (Daily Close)
RISK-REWARD: 1:6
Caution: Close at least 50% position size at TP1 and then trail SL to avoid losing incurred profits in case of unforeseen market conditions.
PLEASE BOOST AND SHARE THE IDEA IF YOU FIND IT HELPFUL.

SYS Long position SYS Long position on weekly time frame, long term trade entry with a buy stop on top of last HH

Breakout Expected...
CMP 105.89 (03-06-2025 02:54PM)
Crossing 107 with Good Volumes may
result in further upside towards 112 - 113
& then around 120 - 125

DNCC LONG TRADE 03-06-2025DNCC LONG TRADE
DNCC has successfully completed its Spike–Channel Accumulation–Breakout sequence, followed by a clean retest of the breakout level. The recent pullback has reversed, indicating readiness for the next leg to the upside, with confirmation from the Volume Gradient.
Price action structure, along with continued support from the EMA-20, further strengthens the case for an impending bullish continuation.
🚨 TECHNICAL BUY CALL – DNCC🚨
BUY1: 15.6
BUY2: 14.55
BUY3: 13.6
📈 TP1 : Rs. 17.6
📈 TP2 : Rs. 18.9
📈 TP3 : Rs. 21.3
🛑 STOP LOSS: BELOW Rs. 11.00 (Daily Close)
📊 RISK-REWARD: 1:3+
Caution: Close at least 50% position size at TP1 and then trail SL to avoid losing incurred profits in case of unforeseen market conditions.
PLEASE BOOST AND SHARE THE IDEA IF YOU FIND IT HELPFUL.

SAZEW LONG TRADE/INVESTMENT TRADESAZEW LONG TRADE
SAZEW recently broke out of consolidation, extending to a high of 1404 before entering a healthy corrective pullback within the context of its ongoing uptrend. During this retracement, the price has established a Reclaimed Order Block and filled Imbalance Zones, which now serve as key demand areas and support levels likely to stall or reverse further downside.
The price is also holding above the EMA-20, providing additional confluence for a potential bullish continuation in the next leg upward.
🚨 TECHNICAL BUY CALL – SAZEW 🚨
BUY1: 1183
BUY2: 1163
BUY3: 1070
📈 TP1 : Rs. 1308
📈 TP2 : Rs. 1388
📈 TP3 : Rs. 1500
🛑 STOP LOSS: BELOW Rs. 1040 (Daily Close)
📊 RISK-REWARD: 1:3.9
Caution: Close at least 50% position size at TP1 and then trail SL to avoid losing incurred profits in case of unforeseen market conditions.
PLEASE BOOST AND SHARE THE IDEA IF YOU FIND IT HELPFUL.

Very Good Monthly Closing.
Closed at 323.58 (30-05-2025)
Very Good Monthly Closing.
Seems like Crossing the Resistance of 329-330
this time.
Potential to touch 390 -400 initially & then
500+ if 395 is Sustained.
However, should not break 305 - 307.

ASTL LONG TRADEASTL has been gaining attention for its potential trend reversal following a prolonged downtrend and an extended phase of post-downtrend consolidation.
The stock confirmed a bullish reversal in December 2025, initiating a structure of Higher Highs and Higher Lows (HHs & HLs) — a clear indication of a trend shift.
During this up-move, price action established an Institutional Demand Block, now acting as a strong support zone, effectively serving as a barrier against further downside.
Buying is recommended in three staggered entries between the Control Point (CP) and Rs. 23.5, to optimize average entry and manage risk.
🚨 TECHNICAL BUY CALL – ASTL🚨
BUY ZONE : Buy in 3 parts between 25.13 to 23.5
📈 TP1 : Rs. 26.5
📈 TP2 : Rs. 28.5
🛑 STOP LOSS: BELOW Rs. 21.3 (Daily Close)
📊 RISK-REWARD: 1:2.76
Caution: Close at least 50% position size at TP1 and then trail SL to avoid losing incurred profits in case of unforeseen market conditions.
PLEASE BOOST AND SHARE THE IDEA IF YOU FIND IT HELPFUL.

Sazgar - Waiting for BudgetSazgar produced excillent performance in both 3rd quarter and 9MFY2025 with PAT of 104% and 186% YoY, respectively.
Technically its looks down at 1144 - 1150 support level.
Budget is the main obstacle.
The government is planning to increase the age limit for importing used vehicles from 3 years to 5 years. If implemented, this could negatively impact volumes of local automobile anufacturers.
The FBR has proposed an increase in withholding tax (WHT) on vehicles with engine capacities above 1,300cc. This would be negative for the local players.
Fundamentally, the light vehicles' manufacturers may face difficulties after budget, being the above, materalized.
Sazgar is excillent company but those external factors are not permitting the buy call.
I am still bullish and will buy more purely on technical basis to recover my losses.

Bid on AI system limited Pakistan top IT services companyABCD pattern
Rsi div
Trend reversal
3 bull point to buy
comment if you have any bearish point.

Though stock is Bullish, but
Though stock is Bullish, but a Very Strong Resistance
is around 11.50 - 12.
Crossing & Sustaining this level may
lead it towards 14 initally.
8 should be the Stoploss as of now. Breaking this level
will drag the price towards 6.50 - 7.40

PSX LONG TRADE (SECOND STRIKE) on LTFPSX LONG TRADE (SECOND STRIKE) on LTF
PSX embarked uptrend bandwagon in Sep 2024. It made a high of 36 and went into pullback/correction.
PSX has reversed up in Spike & Gap Pattern – after completing all reversal events like AR, SC, ST, it has shown reversal supported by Volume Spread. It had a healthy pullback, during which we guided to Buy Low and Sell High. Now it is ready for a Swing Trade.
🚨 TECHNICAL BUY CALL – PSX🚨
BUY1: 26.66
BUY2: 26.00
BUY3: 25.67
📈 TP1 : Rs. 29.4
📈 TP2 : Rs. 32.8
📈 TP3 : Rs. 35.96
🛑 STOP LOSS: BELOW Rs. 23.5 (Daily Close)
📊 RISK-REWARD: 1:4.6
Caution: Close at least 50% position size at TP1 and then trail SL to avoid losing incurred profits in case of unforeseen market conditions.
PLEASE BOOST AND SHARE THE IDEA IF YOU FIND IT HELPFUL.

AGHA LONG TRADE (SECOND STRIKE) on LTFAGHA LONG TRADE (SECOND STRIKE) on LTF
AGHA made a high of 20.8 in 2021- after inception in PSX.
Sooner than later, it went in downtrend hitting its all-time lows.
It then made an effort to go in uptrend but failed to go past 16 and entered in to correction.
Now it has shown reversal in the form of Spike, conformed by price above EMA-20 and supported by Volume Gradient. Its Pull Back is a Double Bottom Pattern– so in terms of Price Action, we are dealing with Double Bottom Bull
🚨 TECHNICAL BUY CALL – AGHA🚨
BUY1: 8.7
BUY2: 8.2
BUY3: 7.9
📈 TP1 : Rs. 9.05
📈 TP2 : Rs. 10.0
📈 TP3 : Rs. 10.55
📈 TP3 : Rs. 11.87 (LONGTERM)
🛑 STOP LOSS: BELOW Rs. 7 (Daily Close)
📊 RISK-REWARD: 1:4.2
Caution: Close at least 50% position size at TP1 and then trail SL to avoid losing incurred profits in case of unforeseen market conditions.
PLEASE BOOST AND SHARE THE IDEA IF YOU FIND IT HELPFUL.

MFL UNORTHODOX LONG TRADEMFL gave an ERC breakout in Dec 2024 - touching a high of 54.5 but showed SOT shortly and started trading in a downward corrective channel. This steep downward channel is actually a Bull Flag as per Price Action Principles. MFL has shown reversal with supportive Volume Gradient confirmations and upward movement from Golden Ratio Fibonacci retracement. Reversal trades are one of the best R:R trades.
It achieved previously given TP1 at 47.
It is currently in a pullback in spike phase of NEW uptrend. Pull backs in this kind of spike phases are usually shallow and brief. Therefore, it is wise/profitable to accumulate MFL at Current Price (CP) and close of each 1D candle – till it crosses 51.8 again. Profit Taking should be at the culmination of next up-leg.
🚨 TECHNICAL BUY CALL – MFL🚨
🎯 BUY STRATEGY: Buy @ CP (47.1) and close of every 1D candle till it reaches 51.8.
📈 TP1 : Rs. 51.8
📈 TP2 : Rs. 54.6
🛑 STOP LOSS: BELOW Rs. 42.9 (Daily Close)
📊 RISK-REWARD: Medium Conviction | 1:2.64 (tentatively)
Caution: Please buy in 3 parts in buying range. Close at least 50% position size at TP1 and then trail SL to avoid losing incurred profits in case of unforeseen market conditions.
PLEASE BOOST THE IDEA IF YOU FIND IT HELPFUL.
