INIL LONG TRADE (SECOND STRIKE) / INVESTMENT TRADEINIL LONG TRADE (SECOND STRIKE) / INVESTMENT TRADE
INIL had been in a persistent downtrend from July to November 2024.
Since then, the stock transitioned into an Accumulation Phase, having completed its Wyckoff Re-Accumulation cycle and successfully reversed via a SPRG from a Key Support and Inducement Zone.
The reversal was confirmed with the required Volume Expansion. INIL has now completed its technical pullback, retesting the Threshold Barrier, and is well-positioned for its next bullish leg.
The Steel sector is anticipated to be a strong outperformer in the near term.
🚨 TECHNICAL BUY CALL – INIL 🚨
🔹 BUY1: Rs. 160
🔹 BUY2: Rs. 150
🔹 BUY3: Rs. 140
📈 TARGET 1 (TP1): Rs. 181.50
📈 TARGET 2 (TP2): Rs. 221.50
🛑 STOP LOSS: Below Rs. 127 (Daily Close)
📊 RISK-REWARD: Approx. 1:3+
Risk Advisory: Secure at least 50% of your position at TP1. From there, trail stop-loss to lock in profits and safeguard against unexpected market shifts.
🔁 Please circulate and support the idea if you find it valuable.

FCL LONGFCL faced a long consolidation almost 137 days, Now it seems it is making higher lows and chances it could hit new Tp1 in short term tp2 in medium term and tp3 in longer term (almost 4-5 months)
It good to accumulate in this zone once stoploss is clear just below 22.39 or 23
Hope to See good gains in this stocks.

PTC LONG TRADE (SECOND STRIKE)PTC LONG TRADE (SECOND STRIKE)
After achieving its given target of 27 by The Chart Alchemist, PTC entered a technical pullback, likely gearing up for a renewed move to form a higher high. PTC continues to display bullish conditions, with Volume Distribution aligning in favor of further upside. During the internal structure retracement, price precisely reacted from the base of the Demand Flip Zone, and the supporting Volume Gradient reinforces the likelihood of a bullish reversal.
🚨 TECHNICAL BUY CALL –PTC 🚨
BUY1: 25.4-25.6
BUY2: 25.25
BUY3: 25
📈 TP1 : Rs. 28.3
📈 TP2 : Rs. 30.68
🛑 STOP LOSS: BELOW Rs. 21.5 (Daily Close)
📊 RISK-REWARD: 1:2.6
Caution: Close at least 50% position size at TP1 and then trail SL to avoid losing incurred profits in case of unforeseen market conditions.
PLEASE BOOST AND SHARE THE IDEA IF YOU FIND IT HELPFUL.

FLYING LONG TRADEFLYING LONG TRADE
FLYING completed its Wyckoff Events and gave a breakout and successfully retested breakout. Post that, entered first wave/ Spike Phase and plotted Historical Highs. Now it is expected to trend in a channel phase, with slower momentum than before (expected) but still in uptrend making HHs and HLs. Also, it has started its third and final up leg. Volume Gradient is encouraging towards FLYING CEMENT up-move journey.
🚨 TECHNICAL BUY CALL –FLYING 🚨
BUY1: 59.9
BUY2: 57.5
BUY3: 54.1
📈 TP1 : Rs. 64.2
📈 TP2 : Rs. 69.77
📈 TP2 : Rs. 78.33
🛑 STOP LOSS: BELOW Rs. 46 (Daily Close)
📊 RISK-REWARD: 1:2.85
Caution: Close at least 50% position size at TP1 and then trail SL to avoid losing incurred profits in case of unforeseen market conditions.
PLEASE BOOST AND SHARE THE IDEA IF YOU FIND IT HELPFUL.

RPL LONG TRADE (SECOND STRIKE)RPL LONG TRADE (SECOND STRIKE)
RPL was in an Upward Channel since Dec 2023, making high of 22.46. afterwards, it posted a Lower High (LH) and traded in a Downward Corrective Channel till recently. The retracement lasted till Fibb Golden Ratio and it made a beautiful UPMOVE at its Major Support, indicating potential reversal which was confirmed by substantial Volume Gradient, ER breakout candle and Price crossing above EMA-20 on 1D TF. It gave a textbook pullback to continue its up-move in coming days.
🚨 TECHNICAL BUY CALL – RPL🚨
BUY1: 17.8
BUY2: 17.1
BUY3: 16.7
📈 TP1 : Rs. 19.58
📈 TP2 : Rs. 21.16
🛑 STOP LOSS: BELOW Rs. 15.3 (Daily Close)
📊 RISK-REWARD: 1:3+
Caution: Close at least 50% position size at TP1 and then trail SL to avoid losing incurred profits in case of unforeseen market conditions.
PLEASE BOOST AND SHARE THE IDEA IF YOU FIND IT HELPFUL.

OTSU LONG TRADE (SECOND STRIKE) FOR ADVANCED TRADERSOTSU LONG TRADE (SECOND STRIKE) FOR ADVANCED TRADERS
OTSU is still in uptrend as it has created an IDP at LTF. Its third stride upside is still pending, indicating price moving further upside. The Volume Gradient narrates the same story.
🚨 TECHNICAL BUY CALL – OTSU🚨
BUY1: 372
BUY2: 345-355
BUY3: 330-340
📈 TP1 : Rs. 400
📈 TP2 : Rs. 438
🛑 STOP LOSS: BELOW Rs. 325 (Daily Close)
📊 RISK-REWARD: 1:7
Caution: Close at least 50% position size at TP1 and then trail SL to avoid losing incurred profits in case of unforeseen market conditions.
PLEASE BOOST AND SHARE THE IDEA IF YOU FIND IT HELPFUL.

KSBP LONG TRADE (SECOND STRIKE)KSBP LONG TRADE (SECOND STRIKE)
Those who missed, KSBP is offering another ride. It has potential to attain targets beyond current price.
It is in Spike Phase and it created several Inefficiency Zones and Defensive POI. Not to forget the Marubozu candles in the past week demonstrating strength of the uptrend.
🚨 TECHNICAL BUY CALL – KSBP🚨
BUY1: 257
BUY2: 247
BUY3: 237
📈 TP : Rs. 278
📈 TP : Rs. 298
📈 TP : Rs. 344 (LONG TERM)
🛑 STOP LOSS: BELOW Rs. 220 (Daily Close)
📊 RISK-REWARD: 1:7
Caution: Close at least 50% position size at TP1 and then trail SL to avoid losing incurred profits in case of unforeseen market conditions.
PLEASE BOOST AND SHARE THE IDEA IF YOU FIND IT HELPFUL.

MACFL LONG TRADE (SECOND STRIKE) on MTFMACFL LONG TRADE (SECOND STRIKE) on MTF
MACFL was in Downward Corrective channel since past 6 months. Now it has given breakout of this channel, supported by Massive Volumes and has created an Axis Line on MTF during this breakout from channel.
This Axis line is a very low risk zone to enter a long trade.
🚨 TECHNICAL BUY CALL – MACFL🚨
BUY1: 18.6
BUY2: 17.7
BUY3: 17.1
📈 TP : Rs. 20.48
📈 TP : Rs. 22.21
🛑 STOP LOSS: BELOW Rs. 16 (Daily Close)
📊 RISK-REWARD: 1:4.21
Caution: Close at least 50% position size at TP1 and then trail SL to avoid losing incurred profits in case of unforeseen market conditions.
PLEASE BOOST AND SHARE THE IDEA IF YOU FIND IT HELPFUL.

SPEL LONG TRADE (SECOND STRIKE)SPEL LONG TRADE (SECOND STRIKE)
SPEL went into uptrend with a Spike in July 2024. Making a high of 56, it pulled back in Wyckoff Re-Accumulation for months. Now it is in upward reversal as indicated by Volume Distribution. Price is trading above EMA-20. It showed a healthy pull back and now resuming its uptrend journey. During this progression, it has made an Axial Line on Day TF, which is a low-risk spot to enter the trade.
🚨 TECHNICAL BUY CALL – SPEL🚨
BUY1: 45.14
BUY2: 43.5
BUY3: 42.6
📈 TP : Rs. 51.86
📈 TP : Rs. 57.27
🛑 STOP LOSS: BELOW Rs. 39 (Daily Close)
📊 RISK-REWARD: 1:2.9
Caution: Please buy in 3 parts in buying range. Close at least 50% position size at TP1 and then trail SL to avoid losing incurred profits in case of unforeseen market conditions.
PLEASE BOOST AND SHARE THE IDEA IF YOU FIND IT HELPFUL.

TGL LONG TRADE (1H TF)TGL LONG TRADE (1H TF)
TGL embarked upon uptrend in Feb 2025. It soon entered in Wyckoff Accumulation Phase and consolidated there for 3 months. It has shown signs of upward reversal leading to a new leg of uptrend - supported by Volume Gradient. During this progression of breakout, it has made a Bullish OB which is a low-risk spot to Enter a long trade. The price is also trading above EMA-20.
🚨 TECHNICAL BUY CALL – TGL🚨
BUY1: 217
BUY2: 211
BUY3: 204
📈 TP1 : Rs. 239
📈 TP2 : Rs. 255
📈 TP3 : Rs. 270
🛑 STOP LOSS: BELOW Rs. 190 (Daily Close)
📊 RISK-REWARD: High Conviction | 1:4+
Caution: Please buy in 3 parts in buying range. Close at least 50% position size at TP1 and then trail SL to avoid losing incurred profits in case of unforeseen market conditions.
PLEASE BOOST AND SHARE THE IDEA IF YOU FIND IT HELPFUL.

ASC LONG TRADEASC LONG TRADE
ASC was in downtrend on HTF in a descending triangle formation – It has shown signs of bullish reversal after making a Spring below a Major trend line and reversing instantly.
It reversed in the form of Spike creating multiple FVGs on the way. This reversal is supported by Volume Distribution. Currently it is in Pullback of this reversal.
It is expected to resume its upward journey after hitting these FVGs.
🚨 TECHNICAL BUY CALL – ASC🚨
BUY1: 7.5
BUY2: 7.0
BUY3: 6.5
📈 TP1 : Rs. 8.66
📈 TP2 : Rs. 9.3
📈 TP3 : Rs. 10.4
📈 TP4: Rs. 12.45 (LONGTERM)
🛑 STOP LOSS: BELOW Rs. 5.47 (Daily Close)
📊 RISK-REWARD: High Conviction | 1:4.7
Caution: Please buy in 3 parts in buying range. Close at least 50% position size at TP1 and then trail SL to avoid losing incurred profits in case of unforeseen market conditions.
PLEASE BOOST AND SHARE THE IDEA IF YOU FIND IT HELPFUL.

MEBL LONG TRADEMEBL LONG TRADE
MEBL was in uptrend previously. It kept plotting HHs and HLs.
For the past 13 months, it has been in Wyckoff Re-Accumulation. It broke out of this Accumulation in May 2025 and plotted a Higher Low, supported by Volume Gradient. Targets are calculated from Measured Move as MEBL is trading on its ATH. Also, it is trading above EMA-20.
🚨 TECHNICAL BUY CALL – MEBL🚨
BUY1: 303
BUY2: 293
BUY3: 283
📈 TP1 : Rs. 327
📈 TP2 : Rs. 350
🛑 STOP LOSS: BELOW Rs. 260 (Daily Close)
📊 RISK-REWARD: High Conviction | 1:3
Caution: Please buy in 3 parts in buying range. Close at least 50% position size at TP1 and then trail SL to avoid losing incurred profits in case of unforeseen market conditions.
PLEASE BOOST AND SHARE THE IDEA IF YOU FIND IT HELPFUL.

POL LONG TRADEPOL LONG TRADE
POL is in uptrend on 1W chart (yellow channel) since end of 2015. Within this channel, it is now following an upward trend line (blue dotted line) since Oct 2022.
It touched the top of the 1W channel in Dec 2024 and started its Downward leg (pink channel).
If we zoom into lower TF (1H - upper window), POL has broken out of this downward channel in a Spike & Gap Fashion with sufficient Volume Gradient creating a Bullish Breaker Block and FVG.
Trade is considered low risk at this Juncture.
🚨 TECHNICAL BUY CALL – POL 🚨
BUY1: 527
BUY2: 524
BUY3: 521
📈 TP1 : Rs. 552
📈 TP2 : Rs. 574
📈 TP3 : Rs. 596
🛑 STOP LOSS: BELOW Rs. 510 (Daily Close)
📊 RISK-REWARD: | 1:3
Close at least 50% position size at TP1 and then trail SL to avoid losing incurred profits in case of unforeseen market conditions.
PLEASE BOOST AND SHARE THE IDEA IF YOU FIND IT HELPFUL.

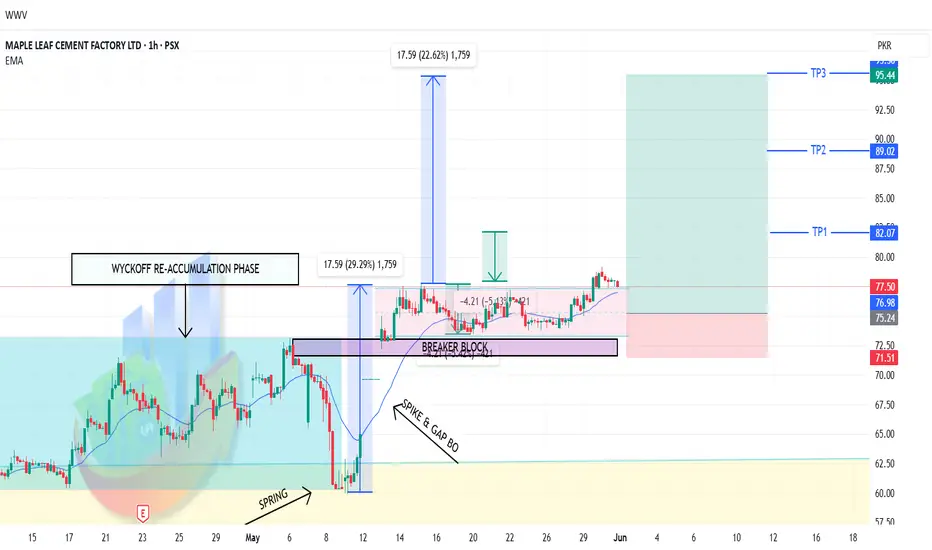
MLCF LONG TRADE (1H TF)MLCF LONG TRADE - on 1H TF
MLCF has been in uptrend since Nov 2024, with a high of 79 on charts.
On LTF/1H, it has recently completed its Wyckoff Re-Accumulation Phase (blue channel) and Broke out of it in shape of Spike and Gap. It continued to consolidate in a Double Bottom Pattern.
This Spike and Double Bottom jointly formed Double Bottom Bull Flag (pink channel). Along with these events, Volume gradient also supports an impending up-move. Importantly, it created a Bullish Breaker block on 1H when it Broke out of the DB Bull Flag, which is a low-risk spot to enter the long trade. The price is also above EMA-20.
Targets have been calculated from different Measured Moves as marked.
🚨 TECHNICAL BUY CALL – MLCF 🚨
BUY1: 77
BUY2: 75
BUY3: 73
📈 TP1 : Rs. 82
📈 TP2 : Rs. 89
📈 TP3 : Rs. 95.25
🛑 STOP LOSS: BELOW Rs. 71 (Daily Close)
📊 RISK-REWARD: High Conviction | 1:5.4
Caution: Please buy in 3 parts in buying range. Close at least 50% position size at TP1 and then trail SL to avoid losing incurred profits in case of unforeseen market conditions.
PLEASE BOOST AND SHARE THE IDEA IF YOU FIND IT HELPFUL.
ATRL HIGH VALUE LONG TRADE / INVESTMENT TRADE - (SECOND ENTRY) ATRL HIGH VALUE LONG TRADE / INVESTMENT TRADE - (SECOND ENTRY)
ATRL completed the Spike Phase of its Uptrend from Oct 2024-Dec 2024, creating a High of 776.
Then it went into an A-B-C correction, marking a Low of 411. It also created a SPRG at the Re-test of BO.
It reversed upwards, supported with ample Volume Gradient. This move from 411-697 constitutes another Spike in prevailing uptrend. This Spike has completed and broken out of Double Bottom Bull Flag.
This BO also established a Bullish Breaker Block at this new High, which is a low risk place to hop-on for a Long Trade journey. Targets have been calculated from different Measured Moves.
🚨 TECHNICAL BUY LEVELS – ATRL 🚨
BUY1: 690-700
BUY2: 670-680
BUY3: 660-670
📈 TP1 : Rs. 777
📈 TP2 : Rs. 877
📈 TP3 : Rs. 986 LONGTERM
📈 TP4: Rs. 1090 LONGTERM/INVESTMENT
🛑 STOP LOSS: BELOW Rs. 600 (Daily Close)
📊 RISK-REWARD: High Conviction | 1:4.75
Caution: Please buy in 3 parts in buying range. Close at least 50% position size at TP1 and then trail SL to avoid losing incurred profits in case of unforeseen market conditions.
PLEASE BOOST AND SHARE THE IDEA IF YOU FIND IT HELPFUL.

LUCK LONG TRADELUCK LONG TRADE
LUCK has been trading in an upward channel (blue) since May 2023.
It recently created an SPRG below previous Support Level and went into Spike Phase of the Reversal. Then it went into Pullback/Downward Corrective Channel (pink) making a HL.
It has broken out of this corrective channel and is ready to start its fresh Upward Leg in the Blue Uptrend Channel. Its Price has crossed above EMA-20, providing confluences for a Long Trade Entry.
🚨 TECHNICAL BUY CALL – LUCK 🚨
🎯 BUY ZONE: Rs. 330-338
📈 TP1 : Rs. 354
📈 TP2 : Rs. 372
📈 TP3 : Rs. 399
🛑 STOP LOSS: BELOW Rs. 307 (Daily Close)
📊 RISK-REWARD: High Conviction | 1:3+
Caution: Please buy in 3 parts in buying range. Close at least 50% position size at TP1 and then trail SL to avoid losing incurred profits in case of unforeseen market conditions.
PLEASE BOOST AND SHARE THE IDEA IF YOU FIND IT HELPFUL.


OTSU is going high and highsOtsu is moving rapidly to high and highs. It seems to cross 500+ level. Its new resistance level is 411, SL is 357, TP is 550
Note: This is not a buy/sell trade call.

APL LONG TRADEAPL LONG TRADE
APL is uptrend since Aug 2023. For one year, it was trading in a slightly upward channel/trading range.
It gave breakout from that trading range in Dec 2024 and made a high of 575. Since then, it went into downward corrective channel and retested the Breakout at its Major Support level.
It gave reversal supported by Volume Distribution. One momentous occurrence is that it has created a Bullish Breaker Block on 1D TF which is a first-rate place to enter a trade.
🚨 TECHNICAL BUY CALL – APL🚨
🎯 BUY1: Rs. 490
BUY2: Rs. 478
BUY3: Rs. 470
📈 TP1 : Rs. 514
📈 TP2: Rs. 559.8
🛑 STOP LOSS: BELOW Rs. 440 (Daily Close)
📊 RISK-REWARD: High Conviction | 1:3
Caution: Please buy in 3 parts in buying range. Close at least 50% position size at TP1 and then trail SL to avoid losing incurred profits in case of unforeseen market conditions.
PLEASE BOOST AND SHARE THE IDEA IF YOU FIND IT HELPFUL.

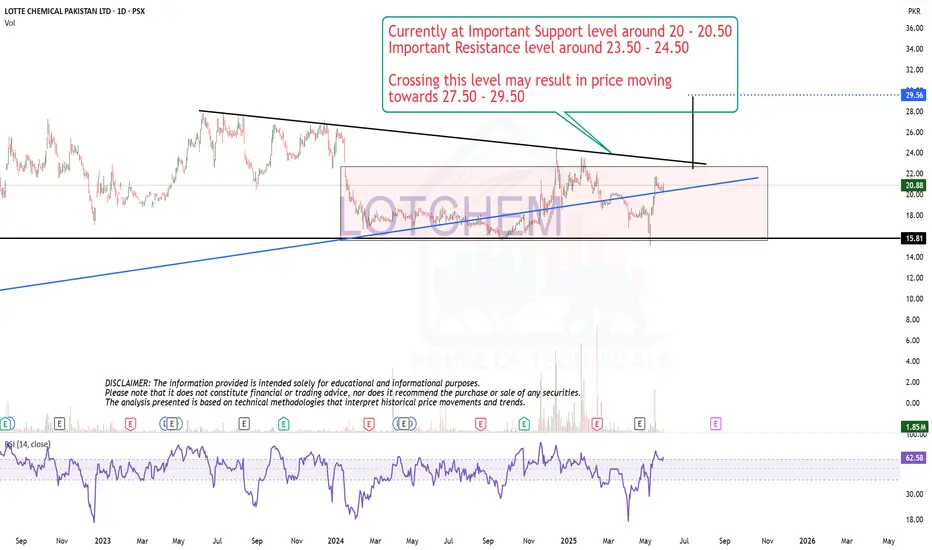
Seems like taking SupportCurrently at Important Support level around 20 - 20.50
Important Resistance level around 23.50 - 24.50
Crossing this level may result in price moving
towards 27.50 - 29.50
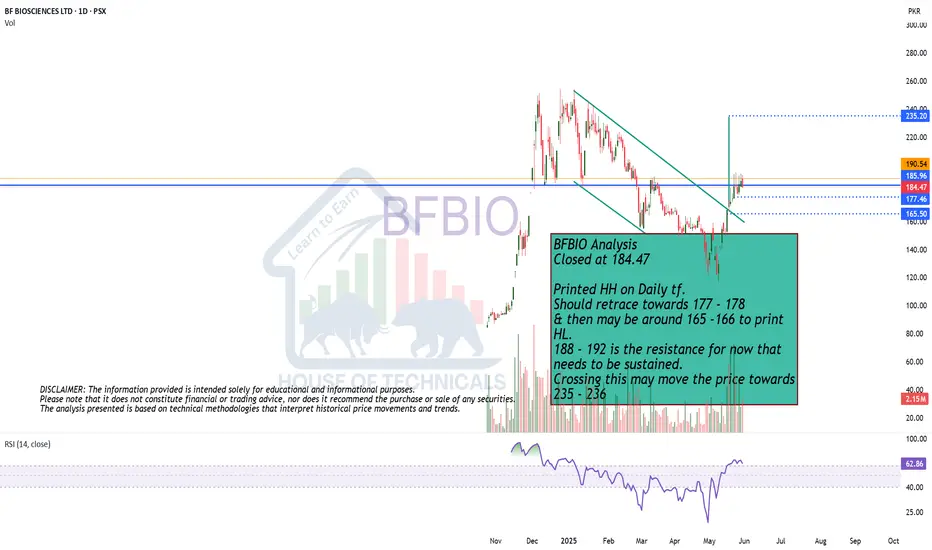
Printed HH on Daily tf.
Closed at 184.47
Printed HH on Daily tf.
Should retrace towards 177 - 178
& then may be around 165 -166 to print
HL.
188 - 192 is the resistance for now that
needs to be sustained.
Crossing this may move the price towards
235 - 236
EPCL ANALYSIS EPCL is in downtrend since long; it was consolidating for a while but that again was only a RE-Distribution Phase.
It then broke down from that and exactly achieved the Measured Move Targets.
Now it has given short term upward reversal (Broke just an Internal Structure High - THIS IS NOT A TREND CHANGE), supported by Volume Gradient.
Those who are already holding EPCL can sell it around 40.
FRESH BUYING NOT RECOMMENDED.

IPAK LONG TRADEIPAK LONG TRADE
IPAK has been in downward channel since its inception in PSX. If it breaks and closes above 22.1, it will cause CHoCH to Bullish. Buying is at CP and Buying Zone as below. Targets have been calculated through measured move.
🚨 TECHNICAL BUY CALL –IPAK 🚨
🎯BUY1: Rs. CP(22.25) and 21.1-22.1
📈 TP1 : Rs. 24.1
📈 TP2 : Rs. 26.3
🛑 STOP LOSS: BELOW Rs. 20 (Daily Close)
📊 RISK-REWARD: 1:5
Caution: Please buy on levels in 3 parts. Close at least 50% position size at TP1 and then trail SL to avoid losing incurred profits in case of unforeseen market conditions.
PLEASE BOOST AND SHARE THE IDEA IF YOU FIND IT HELPFUL.
