Exail Technologies European Drone Warfare and Robotics. Exail Technologies (previously Groupe Gorge S.A.) is a French tech company specializing in drones, robotics, and maritime autonomous systems, with growing exposure to defense and industrial markets.
It’s on a clear uptrend, sitting well above its 50 and 200-day EMAs with momentum firmly in play. Volume is steady, with recent trading activity picking up compared to its long-term averages, reflecting consistent investor interest.
If you’re looking for a high-growth, high-momentum play in the drone warfare / European tech space, Exail is showing strength. Just keep an eye out for a pullback, which could offer a cleaner entry without chasing the current highs.
Might be worth a watch.

Airbus Wave Analysis – 10 July 2025- Airbus broke resistance zone
- Likely to rise to resistance level 190.00
Airbus recently broke the resistance zone lying between the resistance level 175.00 (which started the earlier sharp downward correction in March, as can be seen from the Airbus chart below) and the resistance trendline of the daily up channel from May.
The breakout of this resistance zone accelerated the active short-term impulse wave iii of the impulse 3 of the intermediate impulse wave (3) from April.
Given the clear daily uptrend, Airbus can be expected to rise to the next resistance level 190.00 (target for the completion of the active impulse wave iii).

SOLB | Confirmed Descending Triangle Breakout – 32% Target📍 Ticker:
SOLB (Solvay SA – Euronext Brussels)
📆 Timeframe: 1D (Daily)
📉 Price: €30.14
📈 Pattern: Descending triangle breakout confirmed on daily close
📊 Breakout Probability estimation: ~73% (short-term triangle breakout upward)
🔍 Technical Setup (Updated on Daily Chart):
Solvay has now confirmed the breakout on the daily timeframe, closing above both the horizontal support and the descending trendline. This marks a multi-timeframe confluence breakout, increasing confidence in the projected move toward upper resistance levels.
✅ Daily candle close above descending resistance
✅ RSI breakout above 55, building momentum
📉 Stop clearly defined under €27.90 → optimal risk profile
📊 Volume expanding, validating move
🧠 Updated Trade Plan:
📥 Entry Zone: €29.90–€30.50 (daily confirmation)
⛔ Stop-Loss: Below €27.90
🔁 Hold while structure remains above descending trendline support
🎯 Upside Targets & Potential Return (from €30.14)
🎯 Target Price Return
Target 1 €33.84 +12.06%
Target 2 €39.76 +32.21%
📊 Pattern Probability – Daily Structure:
📐 Pattern: Descending Triangle Breakout
🔺 Upward breakout probability: ~73%
🎯 Full measured move supports Target 2 if buyers remain active
⚠️ Technical Signals to Watch:
🔎 Retest of descending line on lower volume = strong
✅ RSI > 55 with bullish structure
📈 Rising volume → growing institutional interest
📊 Price reclaiming structure from broader daily consolidation
💬 Solvay is transitioning from a textbook 4H breakout to a multi-day continuation setup. The alignment of pattern, structure, and momentum makes this one of the cleaner swing setups on the European market right now.
🔔 Follow @TargetTraders for high-probability technical trades.
#SOLB #BreakoutSetup #DescendingTriangle #TechnicalPattern #SwingTrade #Euronext #TargetTraders #VolumeBreakout #ChartAnalysis

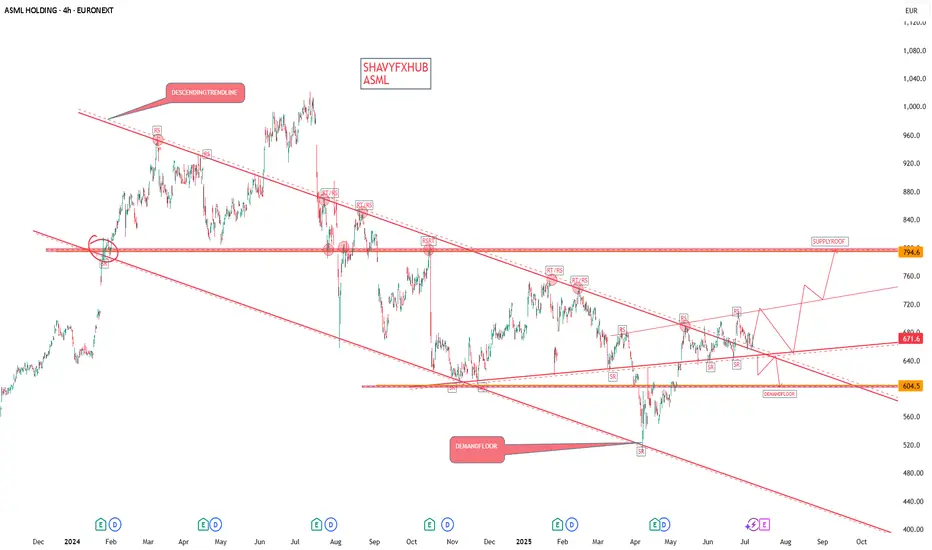
ASMLASML Holding
ASML closed at $671.6 on July 7, 2025.
Market Capitalization:
ASML's market cap is approximately $302–$314 billion as of early July 2025, making it one of the world’s 30 most valuable companies.
Key Financials and Outlook
Next Earnings Release:
Scheduled for July 16, 2025. The consensus estimate for Q2 2025 earnings per share is $5.94, with analysts expecting continued strong performance driven by demand for advanced lithography equipment
Recent Performance:
Q1 2025 EPS: $6.31 (beat consensus by $0.19)
Q1 2025 Revenue: $8.77 billion (above consensus)
Guidance for Q2 2025 Revenue: $7.6–$8.1 billion
Valuation Metrics:
P/E Ratio: Approximately 29.8–35.8, based on trailing earnings.
Dividend: ASML continues its capital return program, including dividends and share buybacks.
Recent Trend:
The stock is currently at a pullback reflecting demand and supply in semiconductor and its equities market
Industry Leadership:
ASML remains the world’s leading supplier of photolithography machines, essential for advanced semiconductor manufacturing. Its EUV (extreme ultraviolet) systems are critical for producing the most advanced chips.
Order Backlog:
The company maintains a robust order backlog, providing revenue visibility despite market volatility.
Global Demand:
Demand from Asia, especially China, continues to be a significant driver, alongside global investments in AI and advanced chip production.
ASML remains a global technology leader with a strong financial position and positive long-term outlook, despite recent share price volatility. The upcoming July 16 earnings report will be closely watched for updated guidance and demand trends in the semiconductor sector
#ASML #AI #STOCKS
Short on BEN (EURONEXT:BENETEAU)High seller pressure with gaps during the march month
Some bad news: "Shares in Beneteau fall 12.3%, headed for their worst day since September 2023, after the motorboat manufacturer said it expects weaker 2025 sales amid a business slowdown"
Bearish until 5.50

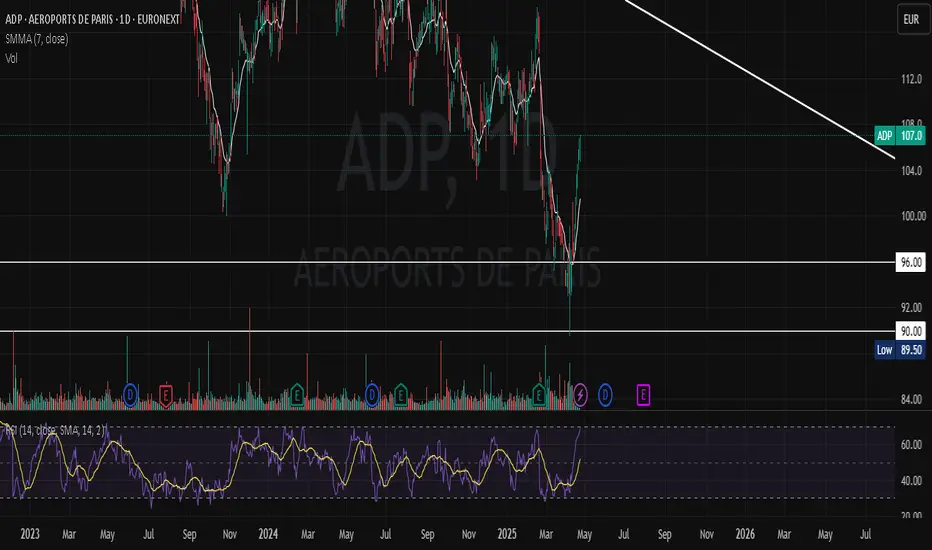
Short on ADP:EURONEXT (Aéroports de Paris)Oversold RSI + Resistance touched twice but never broken + Dividends already paid
Opening price: 113.50 today 06/06/2025
TP set at 112.0
Leverage: x4
Potential gain: 1,30% x 4 = 5,20%

AEDIFICA - Alternative Medium Timeframe Elliot Wave analysisIn this scenario, I’m interpreting the larger Wave 1 as a potential leading contracting diagonal, where each subwave is unfolding as a zigzag (3-3-3-3-3) rather than the typical 5-3-5-3-5 structure.Currently, we appear to be in Wave 4 (Pink) of this diagonal, which seems to be in the final stages of its downward leg before starting Wave 5 the final move of the pattern. The decline in Wave 4 (Pink) may take the form of either a WXY or an ABC correction; continued price development will help validate the count.
I believe this interpretation aligns well with the recent price action, particularly because the market has been moving sideways for quite some time now without delivering a convincing impulsive move to the upside.
Disclaimer: This analysis is for informational and educational purposes only and should not be considered financial or investment advice. All trading involves risk, and you should perform your own due diligence before making any trading decisions. The author is not responsible for any losses that may arise from reliance on this content. Always trade at your own risk. #AED

ASML ASML is trading around $659.4per share The stock has a market capitalization of approximately $312 billion
Company Overview
ASML is a global leader in advanced semiconductor equipment, specializing in lithography systems essential for chip manufacturing, including extreme ultraviolet (EUV) and deep ultraviolet (DUV) technologies.
The company serves major semiconductor manufacturers worldwide, including in Asia (China, Japan, South Korea, Taiwan), Europe, and the US.
CEO: Christophe D. Fouquet
Headquarters: Veldhoven, Netherlands
The next earnings announcement is scheduled for July 16, 2025, which will provide updated guidance and insights into demand trends, especially from China and the AI-driven semiconductor sector.
ASML continues capital returns via dividends and share buybacks, supporting shareholder value.
Summary
ASML remains a dominant player in semiconductor manufacturing equipment with strong financials and growth prospects driven by AI and chip demand. While the stock has retreated from its peak, it maintains a bullish technical setup
In brief:
ASML trades near 659.4$ with a market cap over $300 billion, supported by robust fundamentals and strong demand for its lithography systems. The stock shows moderate bullish momentum with upside potential ahead of its July earnings release.
#ASML #STOCKS #AI

AEDIFICA - Micro Timeframe EW-Analasyis *Updated* VersionThe bigger picture remains unchanged. As mentioned in the previous count, the Orange Wave 1/2 has either completed or is very close to completion. I can now say with confidence that we're approaching the end of Wave 2, which appears to be unfolding as an ABC correction within that second wave.
Disclaimer: This analysis is for informational and educational purposes only and should not be considered financial or investment advice. All trading involves risk, and you should perform your own due diligence before making any trading decisions. The author is not responsible for any losses that may arise from reliance on this content. Always trade at your own risk.

SOLB | Descending Triangle Breakout – Targeting +34% MoveTicker: EURONEXT:SOLB (Solvay SA – Euronext Brussels)
📆 Timeframe: 4H (4-hour)
📉 Price: €31.58
📈 Pattern: Descending triangle breakout from horizontal support
📊 Breakout Probability : ~73% upward breakout (short-term triangle)
🔍 Technical Setup:
SOLB has successfully broken above a descending resistance line, bouncing off a solid horizontal support level near €28.00. This forms a bullish descending triangle breakout – a structure that historically resolves upward in short- to mid-term timeframes.
✅ Confirmed breakout from descending triangle
🟢 RSI pushing above 56 = bullish short-term momentum
📉 Defined support below = favorable risk/reward
🧠 Trade Plan:
📥 Entry Zone: €31.40–€31.70 (post-breakout confirmation)
⛔ Stop-Loss: Below €27.90 (under support base and triangle invalidation)
🎯 Upside Targets & ROIC (from €31.58):
Target Price Return
🎯 Target 1 €33.84 +7.15%
🎯 Target 2 €39.76 +25.9%
📊 Pattern Probability – Based on Bulkowski:
📐 Pattern: Descending Triangle (short-term breakout)
🔺 Upward breakout probability: ~73%
💹 Measured move confirms Target 2 if volume remains elevated
⚠️ Technical Signals to Watch:
🔎 Strong green candle breaking the triangle → initial confirmation
✅ RSI breakout with no bearish divergence = supports continuation
📈 Volume spike = buyer interest returning
💬 Solvay’s breakout is a classic textbook move off strong horizontal support.
This is a high-probability swing setup with tight risk and excellent upside potential.
#SOLB #BreakoutSetup #DescendingTriangle #TechnicalPattern #SwingTrade #TargetTraders

With new wars appearing, is THALES a good buy?Pros:
Massive scale & diversified contract base
-€18 billion in annual revenue, 50+ years in defense—among Europe’s largest contractors .
Secured key recent contracts:
-NATO NCOP/BMD Phase 3 missile-defense and awareness system (ongoing since 2012, renewed in early 2025) .
-NATO NCIA IT modernization contract (~€100 million+, six years) awarded via Proximus consortium .
-Portuguese “ForceShield” VSHORAD air-defense system via NSPA .
These show active involvement and political support in large, multiyear NATO/U.S.–backed defense programs.
Exposure to rising defense budgets
-With the new 5% NATO defense-spending pledge, countries are stepping up military expenditures—boosting demand for Thales’ radar, missile, and communication systems .
-Positioned to capture billions more as defense budgets grow across Europe.
Cons & Risks
Size limits rapid gains
-Large-cap stocks like Thales require major updates to move—tens or hundreds of millions in net new orders… a small contract won't cut it.
-Expect slower reactions than mid-caps like Hensoldt or THEON.
Valuation sensitivity
-With high valuation levels, share price can dip on a valuation reset, even with decent results.
-A disappointing earnings quarter or negative macroeconomic news could chip away at gains.
Execution & political headwinds
-Big contracts, like NATO BMD, are subject to delays or cost overruns, affecting profitability.
-Geopolitical sensitivities (e.g., with Russia, Turkey, internal EU politics) can jeopardize projects or license approval.
D) Mixed analyst sentiment
-Although consensus leans positive, there are also Hold and Sell recommendations—some analysts worry about long product cycles and execution risks .
-Disclaimer: This analysis is for informational and educational purposes only and does not constitute financial advice, investment recommendation, or an offer to buy or sell any securities. Stock prices, valuations, and performance metrics are subject to change and may be outdated. Always conduct your own due diligence and consult with a licensed financial advisor before making investment decisions. The information presented may contain inaccuracies and should not be solely relied upon for financial decisions. I am not personally liable for your own losses, this is not financial advise.

BESI will get back to 170Weekly chart displays a compelling case for further Bullish continuation, next middle-term target is 170:
- April was typical resistance = support price action, re-testing 22's High, 23's & 24's Low
- False Breakout below the symmetrical Triangle projects a measured move breaking out on the upside
- July' 24 (`170) was a Bear surprise, lots of scaling-in Bulls take profit and liquidate their longs. I'd expect sideways consolidation for many weekly bars
- If Bulls manage to break that ceiling, long-term 270 is feasible

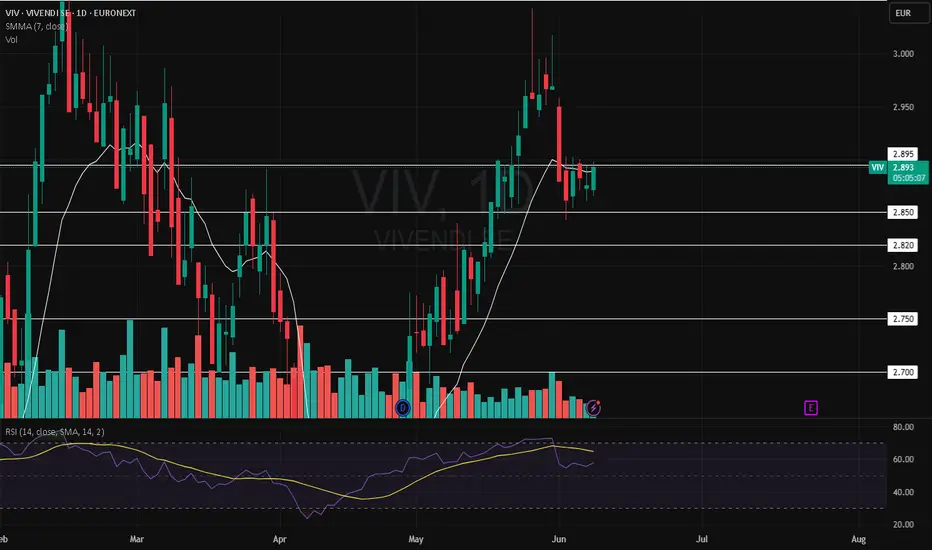
Short on VIV (EURONEXT:VIVENDI)Daily and weekly oversold RSI + resistance touched two times without breacking + decreasing volumes. Looks like sellers are winning the battle.
Opening price today at 2.895
TP set at 2.850
SL set at 2.905
Potential gain: +3% (1,5 x 2 leverage)
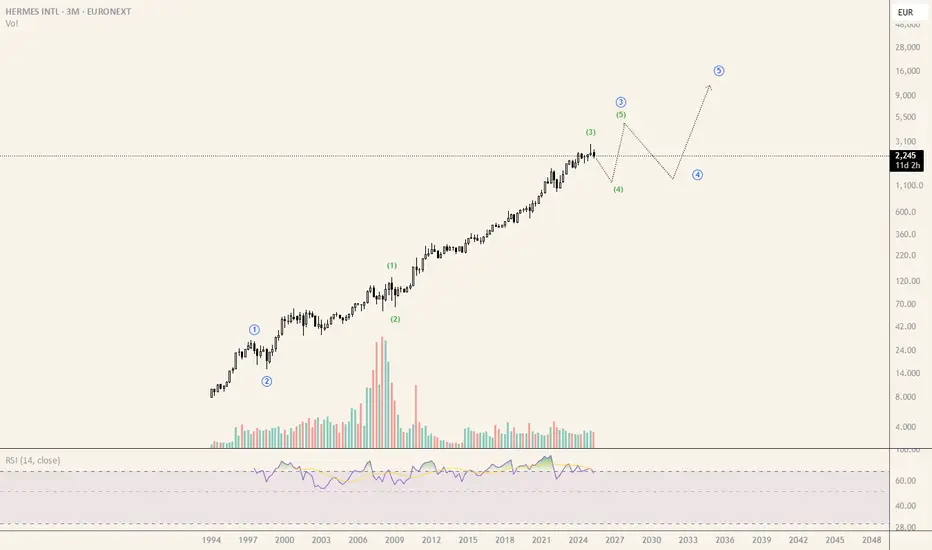
RMS - 3M - Projection over the next yearsHermes , 3 months timeframe
Keep pushing and pushing but i am expecting to the 4 of the 3 back to 1200 over the next years.
Then 5 of the 3 to at least 4600.
Many things can happen until there.
Just for fun :)
KERING is ready to fly againKERING has seen his price fall and fall since COVID crisis.
This idea has two majors factors, one are fundamentals and the other is a technical analysis to buy in the correct price.
FUNDAMENTALS
Attractive Valuation
Kering currently trades at approximately 1/3 of the forward price‑to‑earnings multiple of its peer Hermès. Whereas Hermès commands a forward P/E of roughly 54×, Kering’s multiple stands near 15× or below. Translated, investors may acquire an analogous portfolio of high‑end brands ( Gucci, Saint Laurent, Bottega Veneta ) at a substantial discount.
New Executive Leadership
In September, Kering will welcome Luca de Meo , renowned for his successful turnaround at Renault, as Chief Executive Officer. Following the announcement, the share price appreciated nearly 12 %, reflecting market confidence in his ability to streamline operations, refine brand positioning and spearhead impactful marketing initiatives.
Diversified Cash‑Flow Streams
Beyond its core fashion, Kering benefits from growing eyewear and beauty segments, each contributing incremental cash flow. Furthermore, the group has divested n on‑strategic real estate assets to deleverage the balance sheet .
The principal near‑term headwinds for Kering are flagship brand and market dynamics.
Gucci’s 24 % revenue contraction in Q4 2024 highlights ongoing sales challenges in the absence of a demonstrable creative turnaround.
Volatility in China threatens both local and tourist luxury spending.
Finally, macroeconomic factors like a stronger euro versus the dollar could further pressure reported profits and consumer demand.
TECHNICAL ANALYSIS
After a big rally, the stock snapped through two critical trendlines, a horizontal support and an uptrend, within the same week, setting the stage for a swift pullback. It’s now settled back at its previous peak, which has flipped into a solid support zone and marks a full 100 % retracement of the prior pattern , an area where buyers often step in.
If you’re thinking of jumping in now, you might dip your toes first: buy a partial position today and keep some powder dry in case the price slides further into the green “buy zone” below €150 .
With the potential to roughly double your money and relatively limited downside (given the strength of this support), this setup looks like a compelling entry point.

AIRBUS STOCK FORMING BEARISH TREND PATTERNAIRBUS STOCK FORMING BEARISH TREND PATTERN.
Price drop sharply after forming high 177.30 and created a lower low.
Market was trading in secondary trend from last few sessions.
After secondary trend, reversal candlestick pattern is been spotted.
Price is expected to remain bearish for upcoming sessions.
On lower side market may hit the targets of 132 $.
On higher side market may test the resistance level of 178$.

Bullish Elliot Wave count on AEDThis is my bullish Elliott Wave count for Aedifica, which I consider the more probable scenario. The corrective structure that began in early February 2020 reached the ideal Fibonacci retracement levels for a sharp correction between 0.5 and 0.618 by October 26, 2023 (not shown in this chart), and has already unfolded over nearly four years.
Despite the fact that price action over the past year has remained largely corrective and we haven’t yet seen a clear impulsive move, I still view this as the most likely count and my preferred scenario. In my view, the yellow micro-degree Wave 1/2 has completed, and we are currently in the third wave impulse, with the lower orange-degree Wave 1/2 either completed or nearing completion.
That said, the recent upward movement still appears somewhat corrective in nature, so we should remain cautious of the potential for a larger correction which I discussed in detail yesterday.

Bearish EW count on Aedifica.Last Yellow 5th wave (micro degree) to the downside to end correction that started on 18/02/2020. If prices moves beyond the ending point of Yellow wave 4, then this count would
be invalidated, suggesting that the bullish count is likely underway.
Ps: The bullish count will be posted later.

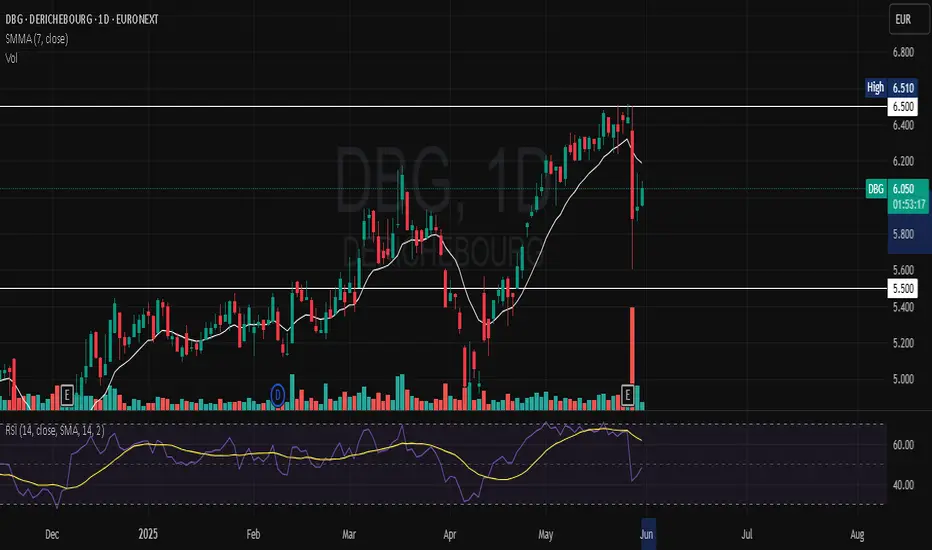
Short on DERICHEBOURG (DGB)Over sold daily and weekly RSI state.
Major resistance level of 6.5 reached multiple times without breacking.
Big red candle and the next day a shooting star candlestick (not sure about this one but it looks like).
Currently hooked on the 6.0 major support level.
It could go up but I doubt, the seller pressure is truely visible and the resistance at 6.5 was pretty strong.
My safe TP target is 5.680 (-5,80%) which is the next major support level.
Sanofi takes a bold step by acquiring Blueprint MedicinesSanofi Makes Bold Move with $9.5 Billion Acquisition of Blueprint Medicines
By Ion Jauregui – Analyst at ActivTrades
French pharmaceutical giant Sanofi (EPA:SAN) has kicked off 2025 with a bold strategic move: the acquisition of U.S.-based biotech Blueprint Medicines (NASDAQ:BPMC) for up to $9.5 billion. The deal, expected to be the largest healthcare acquisition in Europe this year, includes an upfront payment of $129 per share, plus contingent value rights (CVRs) tied to the commercial success of BLU-808, a treatment for systemic mastocytosis.
With this acquisition, Sanofi secures full control of Ayvakit, currently the only approved treatment for this rare disease, thereby strengthening its position in the lucrative rare diseases segment.
Strong Financial Momentum in 2024
Sanofi’s latest annual results confirm the company’s solid trajectory. In 2024, the group generated €41.081 billion in revenue, representing a 11.3% increase at constant exchange rates. Adjusted net income reached €8.912 billion, up 4.1%, despite cost pressures in some segments.
Flagship drug Dupixent, developed in partnership with Regeneron, brought in €13.072 billion, accounting for nearly a third of total group revenue. The vaccines segment also performed strongly, led by Beyfortus sales, with a growth of 13.5%.
Favorable Market: Technical Analysis
Sanofi shares have also been enjoying a positive trend. As of yesterday’s close, the stock was trading at €86.77, with a bullish pre-market and not far from its annual high of €106.20. From May to May, the stock gained as much as 47.43% year-over-year, reaching all-time highs. After the announcement of U.S. tariff policies, the stock corrected nearly 21%, but quickly recovered from a key support level at €82.51, now hovering near €87 with a positive outlook.
The only technical concern lies in the bearish crossover of moving averages observed earlier this year. Should this acquisition reinforce Sanofi’s fundamentals, the resistance level around €93.70 may soon be breached and potentially become new support. Failure to do so, however, could see a short-term pullback toward €67.78. What’s clear is that the company is committed to maintaining its year-over-year growth trend and pushing for new record highs.
Key technical levels:
• Support: €79.80 (current point of control and mid-range zone)
• Immediate resistance: €106.20 (52-week high)
• RSI: 37.45 – signaling an oversold zone, possibly ready for recovery
• Moving Averages: Showing a downward trend this quarter, requiring a shift to resume the bullish path
From a fundamental perspective, the stock trades at an estimated P/E ratio of 12.7, which still offers value considering its earnings outlook and a solid dividend yield of 3.8%.
Share Buyback and Clear Roadmap
As part of its shareholder value strategy, Sanofi has launched an ambitious €5 billion share buyback program, equivalent to 4% of its capital. This move reflects management’s confidence in the company’s performance and comes amid strong cash flow generation.
For 2025, Sanofi projects mid-to-high single-digit revenue growth and a low double-digit increase in adjusted net income.
Conclusion: Innovation, Profitability, and Global Ambition
The acquisition of Blueprint Medicines not only marks the largest healthcare deal in Europe this year, but also cements Sanofi’s strategic shift: focusing on innovative treatments, specialized markets, and global expansion. With a solid financial foundation, a technically strong stock, and a more focused product portfolio, Sanofi is emerging as a major player in the healthcare sector for 2025.
*******************************************************************************************
The information provided does not constitute investment research. The material has not been prepared in accordance with the legal requirements designed to promote the independence of investment research and such should be considered a marketing communication.
All information has been prepared by ActivTrades ("AT"). The information does not contain a record of AT's prices, or an offer of or solicitation for a transaction in any financial instrument. No representation or warranty is given as to the accuracy or completeness of this information.
Any material provided does not have regard to the specific investment objective and financial situation of any person who may receive it. Past performance is not reliable indicator of future performance. AT provides an execution-only service. Consequently, any person acting on the information provided does so at their own risk.

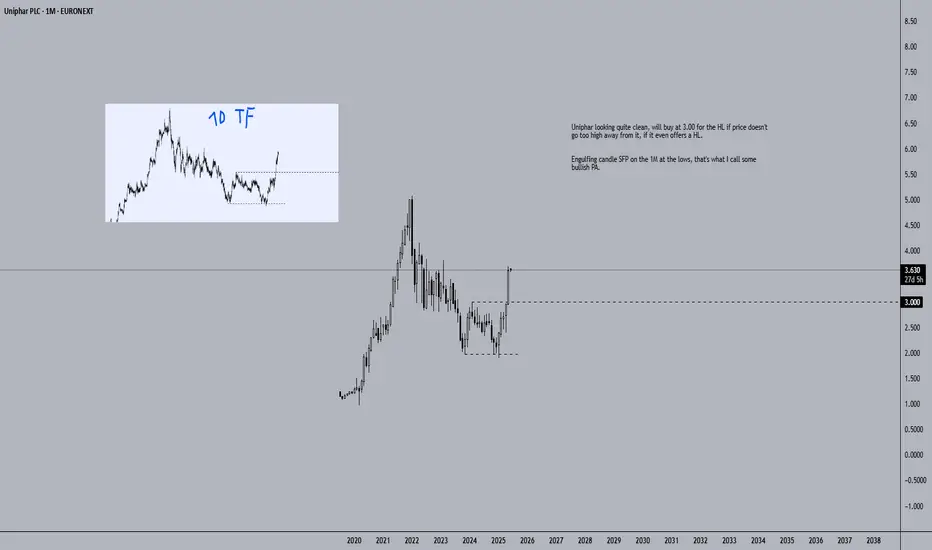
Uniphar Looking Quite CleanUniphar looking quite clean, will buy at 3.00 for the HL if price doesn't go too high away from it, if it even offers a HL.
Engulfing candle SFP on the 1M at the lows, that's what I call some bullish PA.
Short on PUBLICIS (PUB)I don't see any major support levels above 74.
Big red candle in the middle of 84 => can't go higher than this resistance level, high pressure of sellers.
Short with a TP at 74.
Warnings that makes me not sure: dividends coming soon so a lot of buyers will probably come + oversold RSI.
