• Products
  • Community
  • Markets
  • Brokers
  • More
Get started
  • Markets
  • /Russia
  • /Stocks
  • /Ideas
ALRS long (sb)ALRS long (sb)
RUS:ALRSLong
by SmartMantoo
TURNING POINT IN INCREASE TREND OF GAZPROM NEFTTECHINCAL ANALYSIS OF MOEX:SIBN What do we have? 
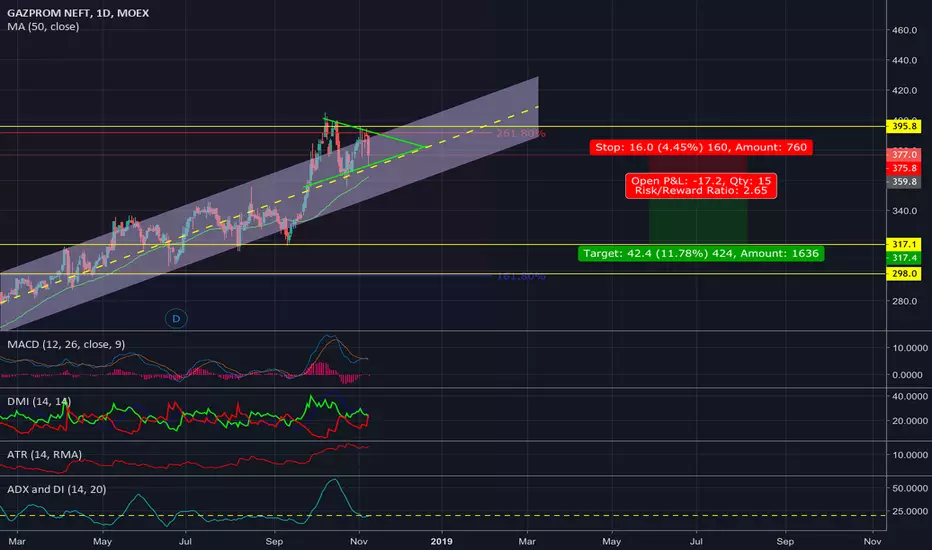
1. From July 2017 to October 2018, share prices of MOEX:SIBN increased by more than 115%. 2. MACD is below 0, which indicates a decreasing trend. 3. The DM shows the beginning of the suppression of the negative trend of the extreme line from the bottom up, which also indicates the beginning of the declining trend. 4. ATR indicator, which is formulated as follows: the higher the value of the indicator, the higher the probability of a trend change; the lower its value, the weaker the trend direction. In this case, the indicator is located at the highest levels at the top (12.4) and indicates the damping of the uptrend. The last time this value was in February 2015 and after that the price rolled back by more than 40%. 5. The ADX indicator is in a low value, which shows a trend towards a reversal or correction of the market. Conclusion. Most likely, prices will decline to a minimum of 317 rubles, which corresponds to 38.2% of Fibonacci retracement from the current growth. The confirmation of this prediction will be a breakout of the current price of the triangle down below the 360 RUB. Trading recommendation: Open short position when reaching the level of 359.8 rubles, take profit at the level of 317 rubles (11.3% profit). Stop loss-the middle of the triangle 377 rubles. (4.45% loss) Alternative scenario: If the price overcomes the previous maximum of 404 rubles. it makes sense to open the long up to 485 rubles. (which corresponds to 361.8 Fibo expansion).
RUS:SIBNShort
by Fandorinn
Updated
RASP Short (SB)RASP Short (SB)
RUS:RASPShort
by SmartMantoo
ROSN 2019 near 444 . alt. 388.8s.c.
RUS:ROSN
by Dimitro
TATN Long (sb)TATN Long (sb)
RUS:TATNLong
by SmartMantoo
ROSN Long (sb)ROSN Long (sb)
RUS:ROSNLong
by SmartMantoo
HYDR Long (sb)HYDR Long (sb)
RUS:HYDRLong
by SmartMantoo
LKOH Short (sb)LKOH Short (sb)
RUS:LKOHShort
by SmartMantoo
MGNT Long (sb)MGNT Long (sb)
RUS:MGNTLong
by SmartMantoo
SEVERSTALSEVERSTAL
RUS:CHMFShort
by Gennadiy2016
PHOR swing shortPHOR swing short
RUS:PHORShort
by SmartMantoo
11
MGNT swing longMGNT swing long
RUS:MGNT
by SmartMantoo
VTB MOEX: Bullish flag and upward movement?MOEX:VTBR On my VTB stock chart of the MOEX Russian stock market, we can see a bullish flag pattern that signals a continuation of the upward movement. This pattern is supported by indicators that indicate an upward movement, I tried to mark them on the chart. On the chart, I also displayed a line of resistance, the breaking through of which will signalize further upward movement. I think it's time to open long positions, the idea is relatively long-term, maybe more than 10 days. For several reasons, I cannot become a member of the Russian stock market, so I wish you good luck, do not forget about stop orders.
RUS:VTBRLong
by mazoto
Updated
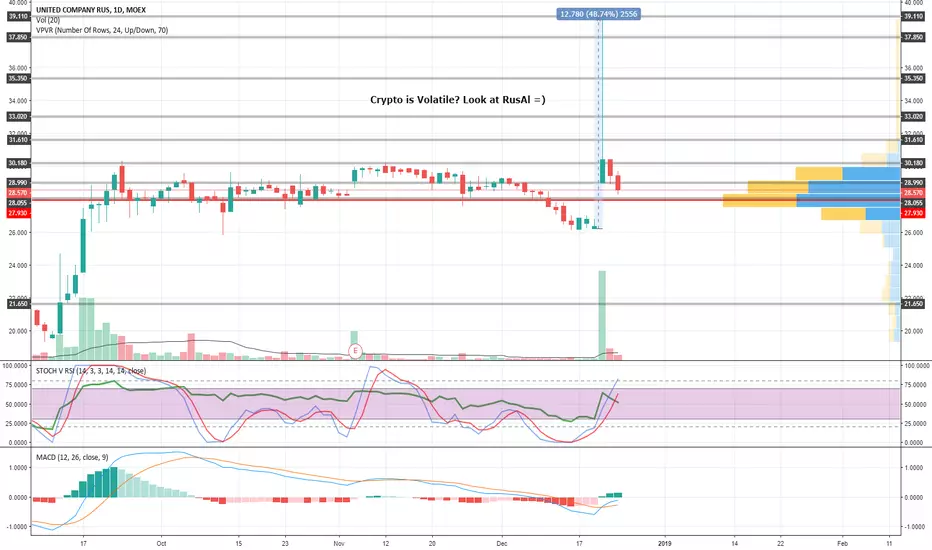
RusAL not Rus anymoreSomeone already made good profit on inside information. But there should be more. Will test support at ~28.35 once again and grow up. In couple of years I would start fixing profits around 58 and 65.
RUS:RUALLong
by WiseAnalyze
Updated
VTB^ 10.02.2019 23:25Elliott and the Law of Vibration.
RUS:VTBRShort
by SERGEY_GORNEEV
VTB^ 10.02.2019 22:58Elliott and the Law of Vibration.
RUS:VTBRShort
by SERGEY_GORNEEV
uncertaintyWait boom long, after exit consolidation. But there is a news background, namely the situation in Venezuela.
RUS:ROSN
by UnknownUnicorn1084844
Updated
YNDXshort
RUS:YDEXShort
by Saleks25
11
MOEX-ALRSLong start
RUS:ALRSLong
by Saleks25
SNGSLong Start
RUS:SNGSLong
by Saleks25
MOEX-SNGSLong Start
RUS:SNGSLong
by Saleks25
Long yndx target yndx #1 2200
RUS:YDEXLong
by UnknownUnicorn1084844
Updated
UNIPROUNIPRO
RUS:UPROLong
by Gennadiy2016
112233445566778899101011111212131314141515161617171818191920202121222223232424252526262727282829293030313132323333343435353636373738383939404041414242
…999999

Select market data provided by ICE Data services. Select reference data provided by FactSet. Copyright © 2025 FactSet Research Systems Inc.© 2025 TradingView, Inc.

More than a product
  • Supercharts
Screeners
  • Stocks
  • ETFs
  • Bonds
  • Crypto coins
  • CEX pairs
  • DEX pairs
  • Pine
Heatmaps
  • Stocks
  • ETFs
  • Crypto
Calendars
  • Economic
  • Earnings
  • Dividends
More products
  • Yield curves
  • Options
  • News Flow
  • Pine Script®
Apps
  • Mobile
  • Desktop
Community
  • Social network
  • Wall of Love
  • Refer a friend
  • House Rules
  • Moderators
Ideas
  • Trading
  • Education
  • Editors' picks
Pine Script
  • Indicators & strategies
  • Wizards
  • Freelancers
Tools & subscriptions
  • Features
  • Pricing
  • Market data
Trading
  • Overview
  • Brokers
Special offers
  • CME Group futures
  • Eurex futures
  • US stocks bundle
About company
  • Who we are
  • Manifesto
  • Athletes
  • Blog
  • Careers
  • Media kit
Merch
  • TradingView store
  • Tarot cards for traders
  • The C63 TradeTime
Policies & security
  • Terms of Use
  • Disclaimer
  • Privacy Policy
  • Cookies Policy
  • Accessibility Statement
  • Security vulnerability
  • Status page
Business solutions
  • Widgets
  • Charting libraries
  • Lightweight Charts™
  • Advanced Charts
  • Trading Platform
Growth opportunities
  • Advertising
  • Brokerage integration
  • Partner program
  • Education program
Community
  • Social network
  • Wall of Love
  • Refer a friend
  • House Rules
  • Moderators
Ideas
  • Trading
  • Education
  • Editors' picks
Pine Script
  • Indicators & strategies
  • Wizards
  • Freelancers
Business solutions
  • Widgets
  • Charting libraries
  • Lightweight Charts™
  • Advanced Charts
  • Trading Platform
Growth opportunities
  • Advertising
  • Brokerage integration
  • Partner program
  • Education program
Look FirstLook First