MEDTECS SGX BUY/LONG 1.15 to 2.65 by end 2021TICKER CODE: 546
Company Name: Medtecs International Corporation Limited
Industry: Medical Instruments & Supplies | Singapore
Technical Analysis
1. Large Pennant Pattern Broke out and retested already
2. Fibonacci Retracement at 0.618
3. Fibonacci Expansion Safe Take Profit Level 1 (Grey Zone) Also the length of Flagpole
Entry: Already Active (0.90-1.15)
1st Partial Take Profit: 2.65 (May consider full exit here)
2nd Take Profit: 3.80 (The market may not reach here as there is not enough historical data to project)
Stop Loss: 0.45
EXPECTED Take Profit in September - December 2021

SIA at $4.54 supportThe short signal on 150421 at $5.45 has reached its down side target at $4.88 and has now broken the weekly pivot support with a short at $4.77 on the medium term targeting $3.23 on the monthly pivot support.
LONG TERM BOUNCE SINCE 150321
MEDIUM TERM DOWNTREND SINCE 100521
SHORT TERM DOWNTREND SINCE 150421
Pivot $4.97
Short positions below 4.97 for 4.54 and 3.23
Long positions above 4.97 for 5.69 and 7.00
youtube link :

OV8 BUY/LONG INCOMING! 1.45 to at least 2.30! TICKER CODE: OV8
Company Name: Singapore Airlines Ltd.
Industry: Grocery Stores | Consumer Defensive | Singapore
Technical Analysis
1. Large Pennant / Falling Wedge Pattern Broke out and WAITING for Retracement
2. Fibonacci Retracement at 0.5 ( Silver Zone)
3. Fibonacci Expansion Safe Take Profit Level 1 (Grey Zone) Also the length of Flagpole
Entry: NOT Ready
Entry at: 1.45 - 1.55
1st SAFE Partial Take Profit: 2.30
EXPECTED Take Profit in November 2021 - March 2022


MEDTECS SGX BUY/LONG 1.15 to 2.65 by end 2021TICKER CODE: 546
Company Name: Medtecs International Corporation Limited
Industry: Medical Instruments & Supplies | Singapore
Technical Analysis
1. Large Pennant Pattern Broke out and retested already
2. Fibonacci Retracement at 0.618
3. Fibonacci Expansion Safe Take Profit Level 1 (Grey Zone) Also the length of Flagpole
Entry: Already Active (0.90-1.15)
1st Partial Take Profit: 2.65 (May consider full exit here)
2nd Take Profit: 3.80 (The market may not reach here as there is not enough historical data to project)
EXPECTED Take Profit in September - December 2021

<TradeVSA> VCP Setup in IFASTSign of Strength in the chart:
1. Reaccumulation with VCP Pattern
2. High volume Upbar testing Resistance
3. NS signal with price above 20/40ma
Disclaimer
This information only serves as reference information and does not constitute a buy or sell call. Conduct your own research and assessment before deciding to buy or sell any stock

BS6 Analysis (Long-Term) for SGX Stocks 1.40 to 2.50TICKER CODE: B56
Company Name: YANGZIJIANG SHIPBLDG HLDGS LTD
Industry: Industrials / Capital Goods / Machinery
Position Proposed: BUY
Technical Analysis
1. Pennant Pattern (Forming) The market should break out and retrace by the end of 2021
2. Fibonacci Retracement at 0.786 ( Silver Zone)
3. 1st Partial Take Profit will be at Fibonacci Expansion Safe Take Profit, Flagpole Length and somewhere near Key Structure Level (Very likely for price rejection/Pullback)
4. 2nd Partial Take Profit MAY NOT REACH we will need to see if 1st Partial Take Profit Level creates some sort of consolidation to decide on an exit or to hold to that level.
1st Entry: NOW READY (1.40-1.45)
2nd Entry: 0.85 (Based on 2nd Scenario) (End 2025-2026)
1st Partial Take Profit: 2.50
Based on 1st Scenario (End 2022-2023)
Based on 2nd Scenario (End 2025-2026)
2nd Partial Take Profit: 3.60 (EST 2029)

Keppel Corp BN4 [1-3 weeks view]This is an analysis for a client.
Technical indicators showing room for further bearish momentum
Bounce before chance of a further drop.
Please do your own due diligence.
Losses can happen so please understand your risks and investment objectives first.

C6L BUY/LONG 4.40 - 6.20! Market could fall back after thisTICKER CODE: C6L
Company Name: Singapore Airlines Ltd.
Industry: Passenger Airlines | Transportation/Logistics | Singapore
Technical Analysis
1. Large Pennant / Falling Wedge Pattern Brokeout and Retraced already
2. Large Head & Shoulders
3. Fibonacci Retracement at 0.786 ( Silver Zone)
4. Fibonacci Expansion Safe Take Profit Level 1 (Grey Zone) Also the length of Flagpole
Entry: Now Ready - 4.40 - 4.70 (The market could reach 4.40)
1st SAFE Partial Take Profit: 6.20
EXPECTED Take Profit in September - December


SingTel is facing bearish pressure Prices are facing bearish pressure where we could see a further drop below this level.

Keppel is facing bearish pressure, potential for further dropPrices are facing bearish pressure from our sell entry in line with our graphical levle and 50% retracement where we could see a further drop below this level.

<TradeVSA> 2nd Pullback in GEO Energy after Re-accumulationSign of Strength in the chart:
1. Pocket Pivot in Reaccumulation
2. High volume breakout
3. NS in 1st Pullback
4. Chart pattern similar like FGV
Disclaimer
This information only serves as reference information and does not constitute a buy or sell call. Conduct your own research and assessment before deciding to buy or sell any stock

Y92 BUY/LONG INCOMING! 0.620 to potentially 1.100 and higher! TICKER CODE: Y92
Company Name: Thai Beverage PCL
Industry: Alcoholic Beverages/Drinks | Consumer Goods | Singapore
Technical Analysis
1. Large Pennant / Falling Wedge Pattern Broke out and Retraced already
2. Large Head & Shoulders
3. Fibonacci Retracement at 0.618 (Golden Zone)
4. Fibonacci Expansion Safe Take Profit Level 1 (Grey Zone) Also the length of Flagpole
5. Full Take Profit at Fibonacci Expansion 1.618 is also at H&S Take Profit (80% of Head Price Range)
Entry: NOT READY
Entry Price: 0.620
1st SAFE Partial Take Profit: 0.910
2nd Partial Take Profit: 1.100
EXPECTED Take Profit in November 2021 - July 2022
NOTE THAT MY BIAS ON this would be a good long climb in the coming years.
Expecting the market to climb to 1.8++

M04.SGX_Rnage Breakout Trade_LongENTRY: 2.00
SL: 1.92
TP1: 2.12
TP2: 2.33
- ADX>20
- RSI>50, RSI>70
- Daily RS +ve
- Daily FFI +ve
- Daily MACD +ve
- Weekly RS +ve
- Weekly FFI +ve
- Weekly MACD +ve
- MA aligned
- Breakout with decent volume today. Prefer a higher volume.

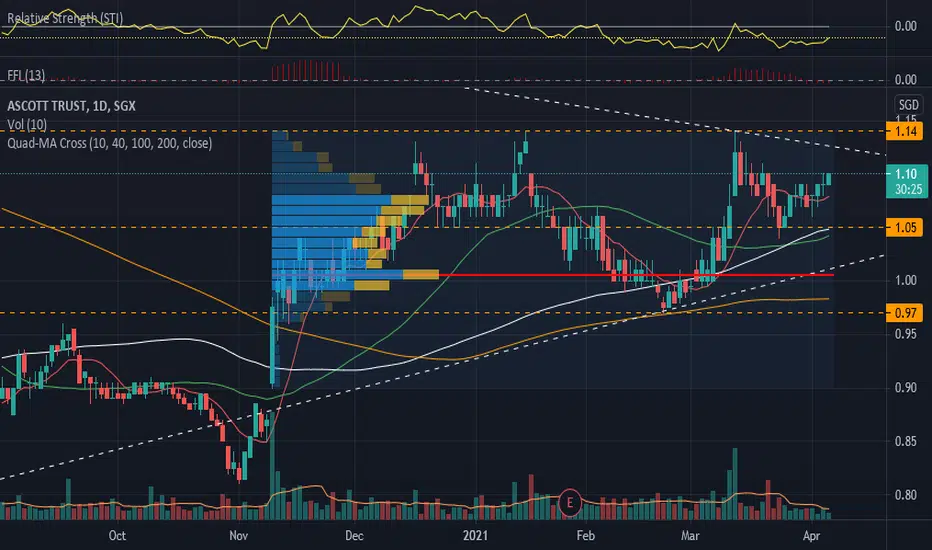
HMN.SGX_Breakout and Retrace Trade_LongENTRY: 1.09
SL: 1.00
TP: 1.24-1.30
- ADX<25. Would like to be higher.
- RSI<60. Would like to be higiher.
- RS and FFI -ve but increasing.
- MACD +ve.
- MAs aligned although 40MA still below 100MA but pointing up.
- Breakout with good volume on 10 Mar 2021 and retraced with lower volume until 1.05 (Resistance-turned-Support) and bounced back.
UOB is testing support, potential bounce Prices are testing support in line with our ascending trend line where we could see a bounce here

DBS is approaching support, potential bounce Prices are approaching support where we could see a bounce here.


SingTel is approaching support, potential bounce Prices are approaching support in line with our ascending trend line and 61.8% retracement where we could see a bounce above this level. Ichimoku cloud is showing signs of bullish pressure as well in line with our bullish bias.

SingPost - Profitable Trade Setup. Pullback to Strong SupportSign of Strength in the chart:
1. Breakout from accumulation with high volume
2. Pullback with Ns signal
3. NS signal near 20ma
Disclaimer
This information only serves as reference information and does not constitute a buy or sell call. Conduct your own research and assessment before deciding to buy or sell any stock

