UOB is approaching resistance, potential reversalPrice is approaching our first resistance in line with our horizontal overlap resistance, 61.8% fibonacci retracement and 100% fibonacci extension where we could see a reversal below this level to our first support target.

OCBC is approaching resistance, potential reversal Price is approaching our first resistance in line with our horizontal swing high resistance, 78.6% fibonacci retracement and 127.2% fibonacci extension where we could see a reversal below this level to our first support target.

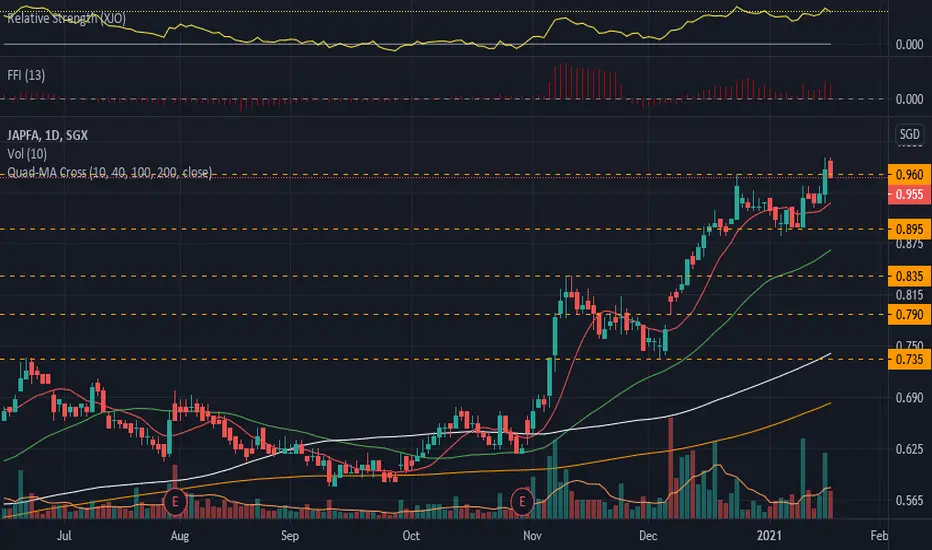
UD2.SGX_LongENTRY: 0.965
TP1: 1.035
SL: 0.890
- ADX>25
- RSI>65
- FFI and RS +ve
- MA are aligned
- Breakout with good volume on 18 Jan 2021
- Entered today on pullback with low volume
UOB is facing bearish pressure, potential reversal Price is facing bearish pressure from our first resistance where we could see a reversal below this level. Ichimoku cloud is showing signs of bearish pressure as well.

DBS is facing bearish pressure, potential for further drop Price is approaching resistance where we could see a reversal below this level, a break below our downside confirmation would provide the bearish acceleration to our first support target

F83.SGX_LongENTRY: 0.285
TP: 0.345
SL: 0.245
- ADX>25
- RSI>65
- MAs are aligned
- Break-up with good volume

SingTel is approaching support, potential bounce Price is approaching our first support in line with our ascending trend line where we could see a bounce above this level

AEM (AWX.SI)Hourly chart on nice trend.
On daily it is resisted at 4.25 and a breakout could be big.

5HH - Symmetrical Triangle5NK at it's all time lowest range
Day Chart showing a symmetrical triangle consolidated over 7 months
Looks like it's breaking soon?

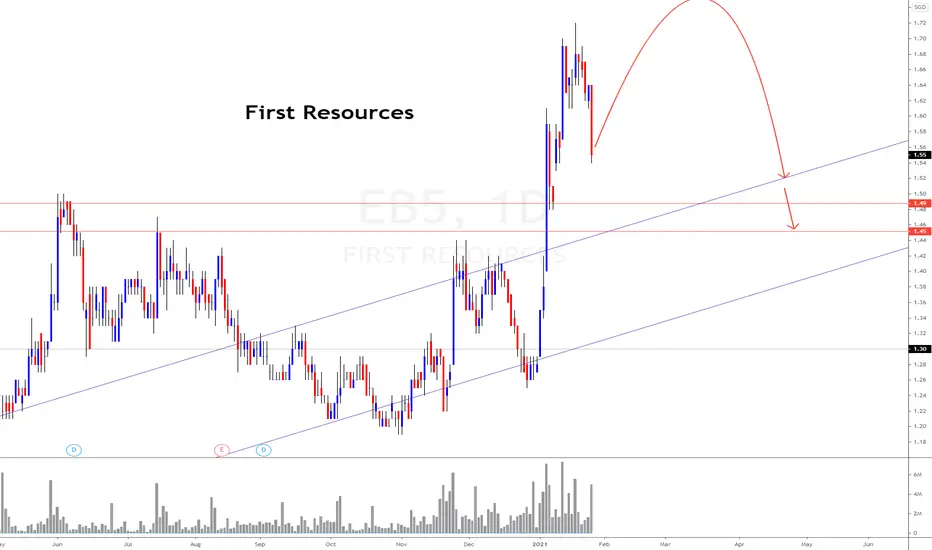
First Resources (SGX)View On First Resources (26 JAN 2020)
This counter popped up in our scanner for the potential BEAR set up.
It may swing up to 1.65~1.68 region but it can go lower eventually toward 1.45~1.50 region.
DYODD, all the best and read the disclaimer too.
Feel Free to "Follow", press "LIKE" "Comment".
Thank You!
Legal Risk Disclosure:
Trading foreign exchange or CFD on margin carries a high level of risk, and may not be suitable for all investors.
The high degree of leverage can work against you as well as for you.
Before deciding to trade foreign exchange you should carefully consider your investment objectives, level of experience and risk appetite.
The possibility exists that you could sustain a loss of some or all of your initial investment and therefore you should not invest money that you cannot afford to lose. You should be aware of all the risks associated with foreign exchange trading, and seek advice from an independent financial advisor.
DISCLAIMER:
Any opinions, news, research, analyses, prices or other information discussed in this presentation or linked to from this presentation are provided as general market commentary and do not constitute investment advice.
Sonicr Mastery Team does not accept liability for any loss or damage, including without limitation to, any loss of profit, which may arise directly or indirectly from use of or reliance on such information.
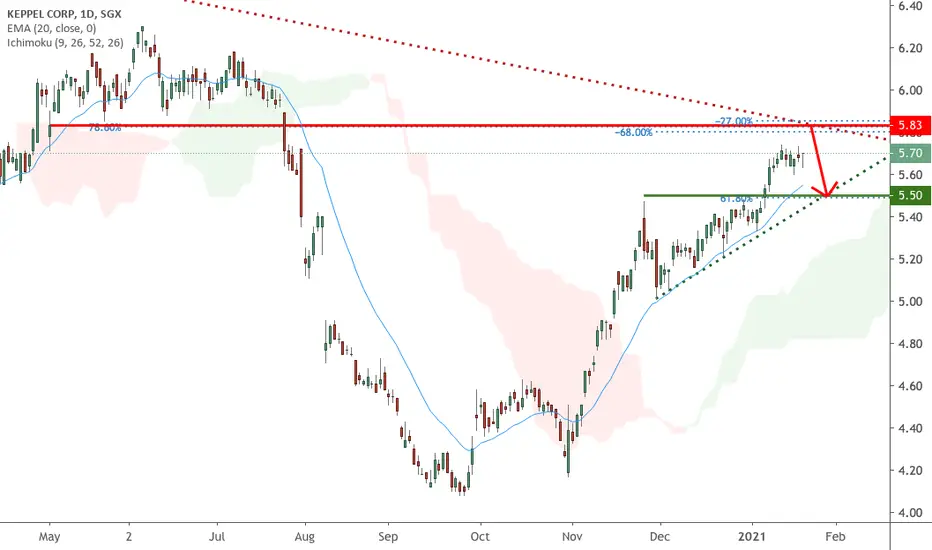
Keppel is testing support, potential bouncePrice is testing support in line with our ascending trend line, 61.8% retracement and extension level where we could see a bounce here.

Raffles Medical (SGX counter)Updated View On Raffles Medical (25 Jan 2021)
This counter popped up in our scanner for the potential BEARish trade.
I expect 0.895 region shall be next.
DYODD, all the best and read the disclaimer too.
Feel Free to "Follow", press "LIKE" "Comment".
Thank You!
Legal Risk Disclosure:
Trading foreign exchange or CFD on margin carries a high level of risk, and may not be suitable for all investors.
The high degree of leverage can work against you as well as for you.
Before deciding to trade foreign exchange you should carefully consider your investment objectives, level of experience and risk appetite.
The possibility exists that you could sustain a loss of some or all of your initial investment and therefore you should not invest money that you cannot afford to lose. You should be aware of all the risks associated with foreign exchange trading, and seek advice from an independent financial advisor.
DISCLAIMER:
Any opinions, news, research, analyses, prices or other information discussed in this presentation or linked to from this presentation are provided as general market commentary and do not constitute investment advice.
Sonicr Mastery Team does not accept liability for any loss or damage, including without limitation to, any loss of profit, which may arise directly or indirectly from use of or reliance on such information.

A78 Long Term HoldInvested very small amount into this micro penny stock @ 0.003
TP: 0.021
What do you all think?

41H Symmetrical TriangleBought this stock in Dec 2020 @0.016 and it has been hovering around 0.015~0.017.
Day/Hourly Charts all look like symmetrical triangle breaking soon (?)
Plan
TP1: 0.023
TP2: 0.026
TP3: Depends on how the stock goes after TP2

SG: SIA ... to continue its fallLooking at the SIA weekly chart, it is obvious that there is a lower high, and a concomitant failure of the 55EMA. 4.15 is the final support, breaking down of this level means more downside.
The MACD, RPM and Volume Divergence are all supportive of the bearish outlook.
Possible to revisit its last low... around 3.50

SG: DBS ran out of juice...Just saw this weekly chart of DBS (D05)...
After a spectacular and amazing run up, DBS is clearly stalling out and poised to fall a good 10%, maybe more.
Candlestick patterns show a bearish inside candle, fallowed by another that gapped down.
point here is that if this is still remotely bullish, there should be better patterns and signs of strength somewhat.
MACD has stalled and is pretty much turning down.
the RPM and Volume Divergence all convergently signal downside to follow.
Notably, the recent spike broke out of a rising channel, and came back in... as with most pattern analysis, this type of breakout failure warrants a follow through out of the other side.
Bearish looking for DBS expected...
As DBS makes up a significant part of the STI, we can expect the STI to behave similarly too...


DBS is facing bearish pressure, potential for further dropPrice is facing bearish pressure and we could see a reversal below our sell entry here. Ichimoku cloud is showing signs of bearish pressure as well in line with our bearish bias.


Keppel is approaching resistance, potential reversal Prices are approaching our resistance in line with our longer term time frame's trend line where we could see a reversal below this level.
Genting a break below support could see a further drop Price is approaching our support target at 0.860 and a break below our ascending trend line and support level could see a bearish acceleration to our next support level at 0.820

Long term trade aligned with technicalsThe tailwinds are obvious - Singapore is gradually opening up to other countries. Airlines and travel industry is going to receive a lot of support (both consumer, government and businesses) and recover from covid eventually. Singapore Airlines is one the best international airlines in the world and is a safe long term play.
The stock price is consolidating with a triangle pattern and a bull flag formation. Coincidentally the next leg up is about the same length of the bull flag pole. Current price of $4.28 is a good entry price. Also has a good chance of breaking the weekly trend line at the top and return to pre covid levels to the $8s. This could be a slow gradual long term rally.

LONG SIA, reclaim of 200ma and bullish consolidationAs we can see, it has been in a prolonged downtrend since 2019 with the 20day ma acting as resistance for the 8 day ma. But alas, the 8day ma has reclaimed not only the 20day ma, but also the 200 day ma, and is now consolidating nicely.
this is apart from the bullish divergences and hidden bullish divergences previously which fuelled the 200ma reclaim.
The idea is a long so long as the 200ma holds. Stop loss should be a daily close below the MA to avoid stop hunting.
