Key levels on GentingPrices are testing resistance where we could see a pullback to test our support level. Overall trend remains bullish as long as prices hold above our support target at 0.860.

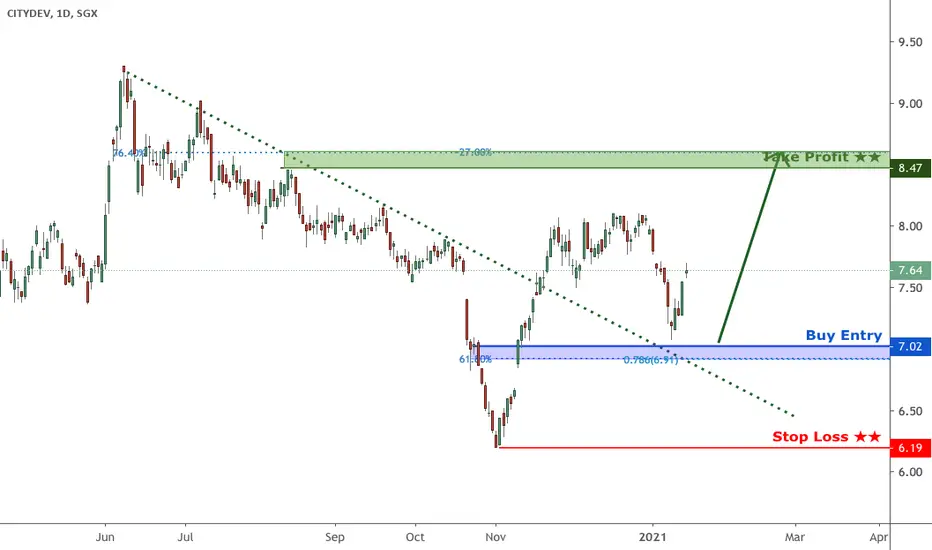
CityDev could see a pullback to test support Price is facing bullish pressure from our support and a pullback to test our buy entry could see a further bounce above this level.


AWX.SGX_LongENTRY: 3.60
TP: 3.82
SL: 3.39
- ADX<25. Prefer it to be higher.
- RSI>60
- FFI +ve
- RSI -ve
- MAs are aligned
- 10MA about to cut above 40MA
- Break downtrend line on 4 Jan 2021 and held up well today with volume.

I07.SGX_LongENTRY: 0.430
TP: 0.480
SL: 0.385
- ADX<25. Prefer it to be higher.
- RSI>50. But pointing up.
- FFI and RSI +ve
- Looks like demand in play with many green volume on up and low volume on retracement since Aug 2020.
- Price squeeze in triangle.

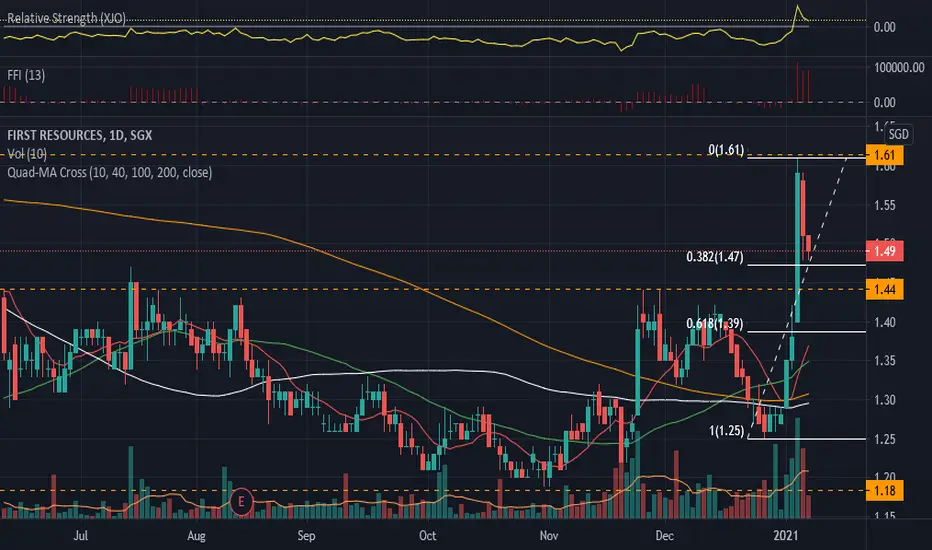
EB5.SGX_LongENTRY: 1.50
TP1: 1.61
TP2: 1.67
TP3: 1.76
SL: 1.39
- FFI and RSI +ve
- Good volume breakup on 6 Jan 2021.
- Retraced with lower volume close to Fib 0.382 level.
- Entered with lower position.
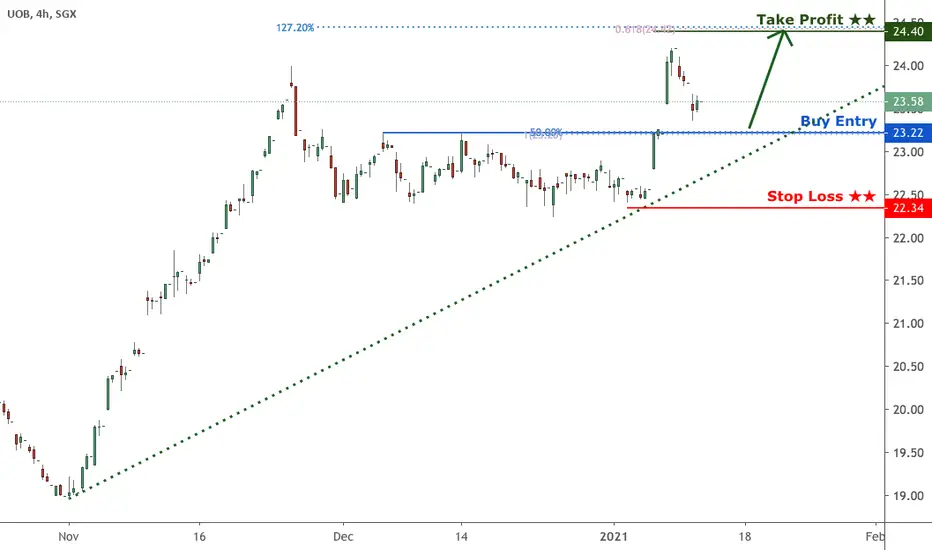
UOB is approaching support, potential bounce Price is approaching our first support in line with our 50% retracement, 100% extension and horizontal pullback support where we could see a bounce above this level to our take profit target.

CityDev is still trading below the resistance line! CityDev is still trading below the resistance line! Our MA20 vs MA50 still shows that price is on a downward movement. Any idea when this drop could end ?

SIA saw trendline breakout to the upside ! SIA has been moving sideways and is seeing trendline breakout to the upside ! MACD is also showing bullish sentiment building slowly.

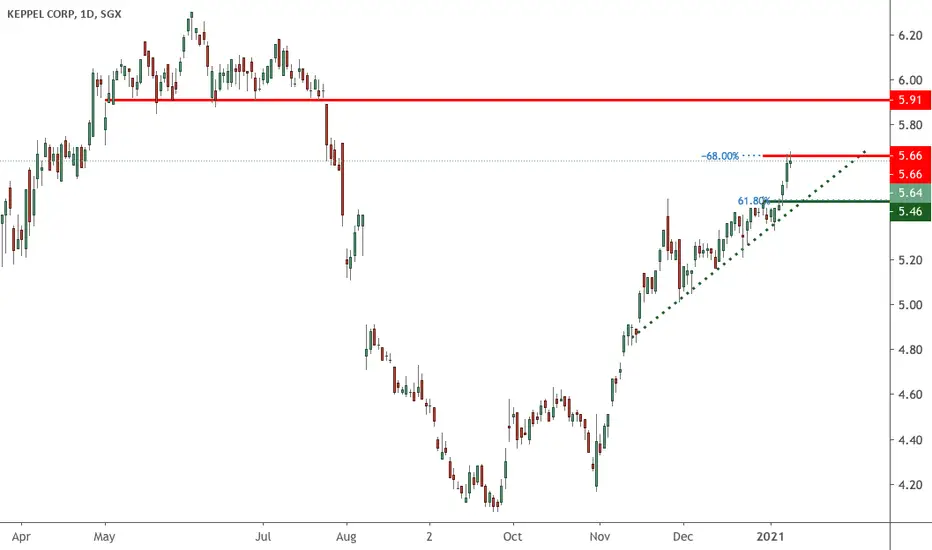
Key levels on KeppelPrices played out nicely in our previous call, here are the updated key levels for me on Keppel. I caution our 5.66 resistance level as it is in line with our monthly descending trend line as well where we could see a pullback to test our support. A break above this level would see a further push up to our next resistance target at 5.91.
[Trade Setup] FortressMinerals (SG)(OAJ)(Risky)(Freebie)Justification: Breakout resistance with good momentum:
Risky: Seems like a small cap with low liquidity

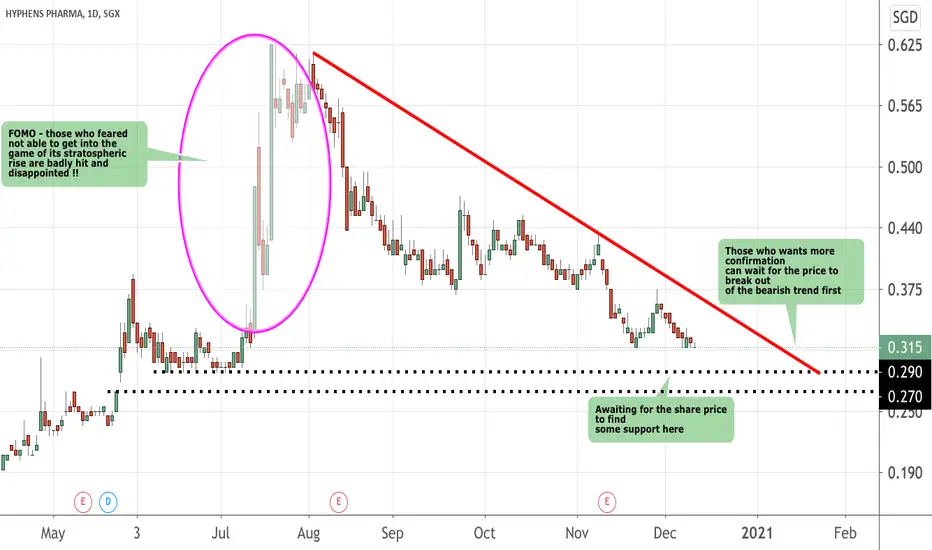
Why you should not chase high price ?Those who bought at 0.565 to 0.625 are sucking thumb and sore about their paper losses (if they are still holding) and will be awaiting for it to go back up and get out on first sign of bullishness.
There are many stocks currently in this stage (pink circle) and I am being more selective now in buying stocks at this juncture.
Should you sell the bank stocks ?Just search through the internet daily and you would find plenty of trade calls on buy and sell stocks, be it an article, video or podcasts. So, I can understand the confusion for new traders/investors. Who do you really listen to ?
I too, suffered this "blind follow blind leaders" syndrome when I first started, made lots of illogical and silly mistakes that could be avoided but nevertheless it happened. So, like they said, one has to pay tuition money to learn from the market, haha.
My 2cents prediction for DBS bank is it is likely to hit around 30-32 dollars before we see a downturn. That means those who picked up at 16 in March 2020 would benefits the most.
From the chart, we can see the historic patterns of DBS Bank. It is going through a stage of consolidation between 8 to 21 dollars since 1998. This is a long term pattern that we can see and notice it has recently (Nov 2020) breaks out from its long term resistance level at 21.48. So long as the price stays above this level , I am inclined to think the probability of it hitting beyond 30 dollars is higher.
Thus, I hope this gives you more clarity if you should buy or sell this stock. It really depends what kind of time frame you are looking at. Those that are advocating you to sell may not be entirely wrong if they hold a shorter time horizon and those that urged you to go long may be in for the long haul. The question to ask is, which time frame are you looking at ?

Is time on your side ?When we look at investment returns, we need to be clear on a few things !
1. Timeline of investment - that means the time frame you are looking to make your returns on investment. Is it 1 year, 5 years or 20 years? So, when I asked this questions to many friends, they answered as a matter of fact - Of course, the sooner the better. Fair enough but how about the risks ?
2. RISKS - so if you want fast returns , can you also stomach the risks ? High returns and low risks in short time frame ? It does not make sense so if anyone offers you that, think thrice. Yes, I heard the people behind shouting they made millions in Cryptocurrency. For every one million made, multi millions are lost as well...........
Thus, when we look at SIA chart for instance, we can potentially spot 3 likely secenarios -
1. last candle shows a doji pattern which means more buyers than sellers so a rebound is in sight.
2. move sideways
3. break down from the support and head down to close the gaps.
Now, if you are a trader, then the above options become crucial information to you since you are likely to either buy or sell this counter at any one time. But, if you are a long term investor, then this short term price fluctuations will be less significant to you. Other good examples include BABA, Tencent, BAIDU, etc recent tumbling of share price.
You have the fundamentals of the company to rely on or should I say, use it to assess its future performance. Therefore, you have a margin of safety over the short term traders in that sense. So, in short term, you may buy at current price and suffered paper loss should it tumbled down to 3.40 level. But, in the long run, you are more likely to make profits compared to the short term traders who go in and out of this stock. Their need to analyse the price action correctly becomes KEY in their decision making.
Also, dun forget that even if it bounce up now , it can retreat just as quickly and we called this a false trap to attract the early bulls. There are so many ways the big boys can manipulate the chart if they want to. Unless you are privy to such information, the chart analysis will still have a certain % of errors especially in the shorter time frame.
Someone who finally saved enough money and is now actively trading or investing in the stock market hoping to catch up for the "missed opportunities" in the past is more vulnerable compare to a young grad who has minimum capital . The latter has plenty of time to play catch up so long as he starts saving and contribute a portion to his investment pot. The compounding effect works to his favour over time!
The senior may have larger capital base but he runs the risks as well if he blindly follows the trend to punt on cryptocurrency which had burnt one too many traders. Or he hopes to make faster returns with bigger position size. Now, all these are part of risk management and is extremely important that one understand well before placing a trade .
I urge all to spend some time to understand your investment objectives, time frame of investment , size of capital allowed to invest, risk tolerance, etc before hurrying to place your trade or searching frantically for the next trade idea, be it currency, index, commodity or even shares of companies.

Long setup for HYPHENS PHARMAPossible inverted H&S and possible break of resistance area with strong volume. SGX:1J5

Hong Kong Land-Accumulate The trend of the stock has managed to stay above its 50MA and immediate resistance is at $5.10. SGX:H78

Top Glove (To be calm is the highest achievement of the self!)View On Top Glove (17 Aug 2020)
Top Glove was a strong bull trend and we believe the main bullish trend is still intact.
Now we are experiencing a typical pullback. It can go down $6.5 region or even $5.
But overall it is still bullish. Time your entry well..
DYODD, all the best and read the disclaimer too.
Feel Free to "Follow", press "LIKE" "Comment".
Thank You!
Legal Risk Disclosure:
Trading foreign exchange or CFD on margin carries a high level of risk, and may not be suitable for all investors. The high degree of leverage can work against you as well as for you. Before deciding to trade foreign exchange you should carefully consider your investment objectives, level of experience and risk appetite. The possibility exists that you could sustain a loss of some or all of your initial investment and therefore you should not invest money that you cannot afford to lose. You should be aware of all the risks associated with foreign exchange trading, and seek advice from an independent financial advisor.
DISCLAIMER:
Any opinions, news, research, analyses, prices or other information discussed in this presentation or linked to from this presentation are provided as general market commentary and do not constitute investment advice. Sonicr Mastery Team does not accept liability for any loss or damage, including without limitation to, any loss of profit, which may arise directly or indirectly from use of or reliance on such information.

Key levels to watch on GentingThese are the key levels for me on Genting, as long as price is holding above our trend line we could expect a further bounce above this level.

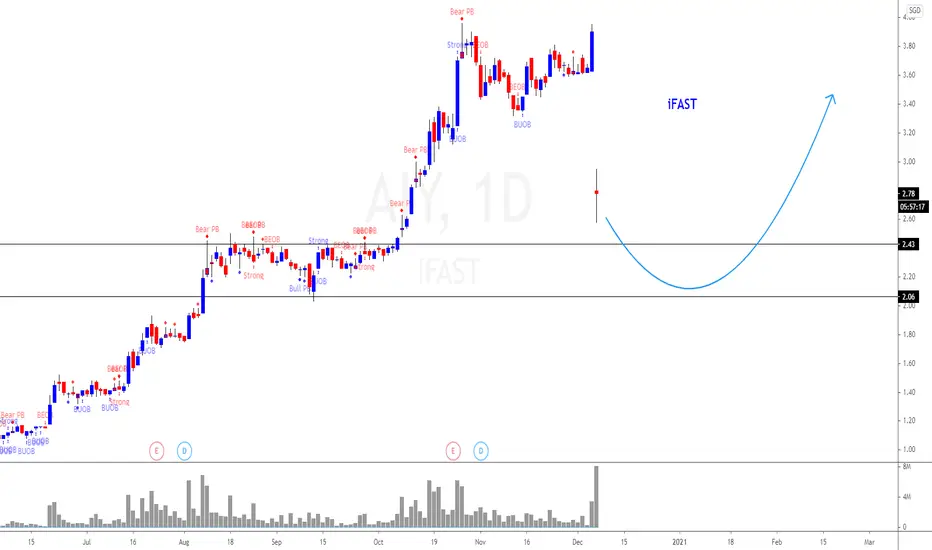
iFast (It drops Fast too)View On i Fast (7 Dec 2020)
What a drop!
We are seeing a sharp rise in the today volume as well.
It is a sign of a lot of SL get triggered.
You need to be careful with buying in. You might get lucky but the risk are there too. So, be very careful with buying in right now.
$2-$2.4 will be the strong support region.
DYODD, all the best and read the disclaimer too.
Feel Free to "Follow", press "LIKE" "Comment".
Thank You!
Legal Risk Disclosure:
Trading foreign exchange or CFD on margin carries a high level of risk, and may not be suitable for all investors. The high degree of leverage can work against you as well as for you. Before deciding to trade foreign exchange you should carefully consider your investment objectives, level of experience and risk appetite. The possibility exists that you could sustain a loss of some or all of your initial investment and therefore you should not invest money that you cannot afford to lose. You should be aware of all the risks associated with foreign exchange trading, and seek advice from an independent financial advisor.
DISCLAIMER:
Any opinions, news, research, analyses, prices or other information discussed in this presentation or linked to from this presentation are provided as general market commentary and do not constitute investment advice. Sonicr Mastery Team does not accept liability for any loss or damage, including without limitation to, any loss of profit, which may arise directly or indirectly from use of or reliance on such information.
<TradeVSA> Cosco - increasing momentum1. Accumulation stage
- low volume with narrow spread bar
- 20/40 MA golden cross spotted
-incresing price and volume trigerred green pentagon
2. Mark up stage
- gap up with increasing volume
-price well supported above the gap
-price sideway approaching 20 MA , support formed around 0.255
3. Daily COC formed
-three narrow spread bar with low volume formed
-followed by green pentagon with increasing volume
- Line Change signal and No Supply signal appeared , ready for next mark-up
Hit the "LIKE" button to support us :)
Disclaimer
This information only serves as reference information and does not constitute a buy or sell call. Conduct your own research and assessment before deciding to buy or sell any stock

Keppel approaching support, potential bounce Price is approaching support in line with our trend line where we could see a further upside here
