DBS Short1) Price attempt to break out 21.55 on 13/10/20 with day high at 21.65
2) Double bottom formation (suppose a bullish reversal pattern) with key Resistance at 21.45
3) MACD Histogram indicate losing momentum
4) RSI fail to stay above 70
5) Fundamentally: quarterly dividend might be a disappointment, usually in Nov.
Short 21.49 - 21.65
Stop loss 21.86

DBS set to aim higher should it break 22.00DBS is set to clear higher after breaking 22.00. The double zig-zag wave is setting the clear pathway to 24.00.

Riding on the China Wave I recently took a small position in this company after having missed a good entry at 3.40 some months back.........
Read this article here
If you understand the Chinese food culture, you would then know that cooking oil is a necessary ingredient in many cuisines. What's not to like, it has a reputable brand name that many households are using (another sticky point that I like).
4.37 is a relatively strong support and yesterday plunge was a good entry for those who are keen to consider going long.

Wilmar (F34.SI) Long 1. Recent pull back is a great discount.
2. TP 4.64
aggresive can consider 4.75 (covering gap)

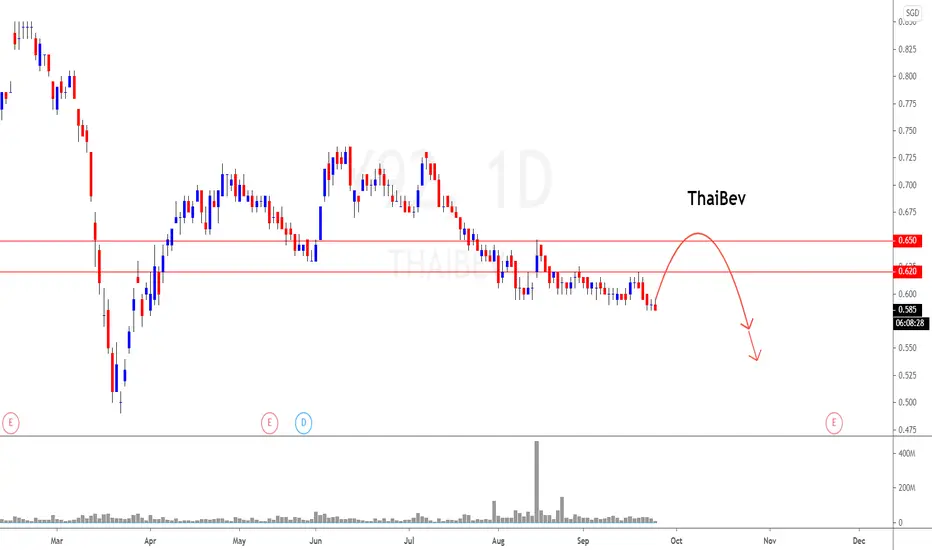
ThaiBev (Attitude is everything)View On ThaiBev
We are seeing potential massive unloading near 0.62-0.65 region and we may see BIGger drop soon.
So, it is better not to buy in at all at this moment.
As long as the price do not overtake $0.655, we will not turn bullish again. It is the make (or) break region.
It can go to 0.55 or even $0.525 region.
DYODD, all the best and read the disclaimer too.
Feel Free to "Follow", press "LIKE" "Comment".
Thank You!
Legal Risk Disclosure:
Trading foreign exchange or CFD on margin carries a high level of risk, and may not be suitable for all investors.
The high degree of leverage can work against you as well as for you. Before deciding to trade foreign exchange you should carefully consider your investment objectives, level of experience and risk appetite.
The possibility exists that you could sustain a loss of some or all of your initial investment and therefore you should not invest money that you cannot afford to lose.
You should be aware of all the risks associated with foreign exchange trading, and seek advice from an independent financial advisor.
DISCLAIMER:
Any opinions, news, research, analyses, prices or other information discussed in this presentation or linked to from this presentation are provided as general market commentary and do not constitute investment advice.
Sonicr Mastery Team does not accept liability for any loss or damage, including without limitation to, any loss of profit, which may arise directly or indirectly from use of or reliance on such information.
Genting is approaching support, potential bounce! Price is approaching support where we could see a bounce from here

SGX is approaching support Price is approaching our buy entry and a test of our buy entry could present an opportunity to buy. Ichiomku cloud is showing signs of bullish pressure as well.

Key levels to watch on Keppel, potential for more upside! We could be seeing room for more upside to our resistance target at 4.91. A test of our support at 4.28 presents an opportunity to go long. That said, I want to caution the absence of any ascending trend line which would make the setup clearer. What are your thoughts on this?

$C6L Time To Load Up Shares On This National CarrierTechnical Analysis
Currently, $C6L is trading within a Descending Channel chart pattern, where it has been making a series of Lower Highs and Lower Lows since 23/3/2020. As of 6/10/2020, the price closed at $3.500, at an area within the Descending Channel. We notice that recently, on 23/9/2020, $C6L has made a Higher Low, with reference from the Low preceding it on 4/8/2020. If we take a look at historical Higher Low formations within the current Descending Channel - where I have marked these points in dotted lines , we notice that every single time a Higher Low is formed, they will only form after touching the slope of Lower Highs, but never before . Not until 23/9/2020. You may be thinking now that this could be a sign that $C6L is about to make a new Lower Low again. However, I highly doubt that is the case. From a technical perspective, based on case precedents, whenever $C6L touches the slope of Lower Lows as seen on 23/3/2020 and 20/5/2020, without fail, $C6L will revisit the slope of Lower Highs. As such, the Lower Low of 4/8/2020 will likely be no exception. If we look at the Elliot Wave Principle, we are currently in a period of Corrective Trends A, B, and C. Dominant Trends 1 to 5 have already been formed during the period between 23/3/2020 and 4/8/2020; while Corrective Trends A and B have been formed on 25/8/2020 and 23/9/2020 respectively. As such, we are now likely in the midst of forming Corrective Wave C, which will bring $C6L up to a minimum of $3.990. In this sense, the premature Higher High would make sense and we are now just waiting for Corrective Wave C to be formed.
If we look at the situation of Singapore Airlines (SIA) and the general gravity of COVID-19 in Singapore, it is looking fairly optimistic. On 5/10/2020, SIA announced that by end-December, it will reach about 15% of its pre-COVID-19 passenger capacity. Compared to the announcement preceding it on 2/9/2020, where SIA announced that they are looking at around 11% by end-November, this is an increase of 4% in projected passenger capacity within a month. On the COVID-19 aspect, the number of new cases daily has been fairly stable, where there has been an average of less than one to one new daily community cases and unlinked cases in the past 2 weeks. The Government is also looking to implement Phase 3, with details of Phase 3 to be released in the coming weeks. This signifies that overall, Singapore has been coping well with the COVID-19 situation. As such, based on all the factors mentioned, I have the conviction that Singapore Airlines will pull through this crisis and come out stronger.
Entries, Price Targets, Stop Losses
The best price for entries would be within the Loading Zone I have indicated in the graph between $3.310 and $3.510, which is near the converging point of the Symmetrical Triangle.
The price target would be $3.990, the minimum price which Wave C will bring $C6L to. I expect this to take at least 1 to 2 months to reach. As such, this is a very long game that we are playing, but with a very good risk to reward ratio. If you don't have other stocks you are eyeing on as an investment and you have some excess cash in the bank, this is a decent company to invest into and check back once a month. Of course, I also have positions in this company from a few months back, at an average cost price of $3.652. I have held the stock to the lows of $3.200 and I have also held it to prices where I was seeing profits. I plan to continue holding it at least until $3.990 because my conviction that SIA will pull through this crisis is strong.
My stop-loss for this particular analysis is $3.250, but personally, I am ready to hold it to $3.000. However, based on the current COVID-19 situation and SIA sentiment, it is rather unlikely that it will visit $3.000 without any serious COVID-19 situation deterioration.
Disclaimer
I do not provide personal investment advice and I am not a qualified licensed investment advisor. I am an amateur investor.
All information found here, including any ideas, opinions, views, predictions, forecasts, commentaries, suggestions, or stock picks, expressed or implied herein, are for informational, entertainment, or educational purposes only and should not be construed as personal investment advice. While the information provided is believed to be accurate, it may include errors or inaccuracies.
I will not and cannot be held liable for any actions you take as a result of anything you read here.
Conduct your own due diligence, or consult a licensed financial advisor or broker before making any and all investment decisions. Any investments, trades, speculations, or decisions made on the basis of any information found on this site, expressed or implied herein, are committed at your own risk, financial or otherwise.
If this post has helped you out in making your investment/trading decision, give it a huge thumbs up, and follow for more updates regarding this ticker symbol!

DBS Short IntradayIndicators enters overbought region.
Short between 20.75 - 20.85, Stop loss 20.95
Potential pull back to MA20 (20.55)

UOB LONG Breaking out $19.50 Have been seeing it consolidating bet $19 - $19.50 for almost a month.
Breaking out $19.50 should see it start trading within the range of $19.50 - $20


OCBC facing bullish pressure Price broke out of key descending trend line, a test of our buy entry could present an opportunity to go long and play to our take profit target. Overall direction is bullish for me now as long as prices holds above the trend line and a break above the immediate ressistance at 8.69 could see prices push higher.

STI Venture V03 pivot at $19.54 for uptrend to continueVenture had resumed its uptrend with a sharp parabolic ascent to $29.50 from Aug 2016 to Mar 2018.
Pivot : $19.54
Buy on a break and close above $19.54
Target $29.50
Stop Loss : $18.92

STI Wilmar F34 seeks $4.54 to resume uptrendWilmar resumed its uptrend LT in July 2019.
Multiple buy signals MT and ST were issued on 270720 and 250920 @$4.41-$4.46
PIVOT : $4.54
Buy at the break and hold above $4.54
Target ATH of $7.29
Stop Loss $4.36
A break of $4.36 will negate the ST buy signal and test $4.04

Keppel Corp - We are looking at one last downside before a rebouDespite roaring positive news, the stock's rally was capped at the supply zone. Hence, we are looking to long at the next potential demand zone highlighted in the chart.


SembCorp Marine ("Leadership and learning are indispensable")View On SembCorp Marine (28 Sept 2020)
We are in the extreme downtrend for the past years and so far, there is no end in sight.
We are seeing very significant transaction aka volume in the recent weeks. Something must be brewing.
Watch out $0.20, if the price ever go back up. then bull may have some chance.
Let's see
DYODD, all the best and read the disclaimer too.
Feel Free to "Follow", press "LIKE" "Comment".
Thank You!
Legal Risk Disclosure:
Trading foreign exchange or CFD on margin carries a high level of risk, and may not be suitable for all investors.
The high degree of leverage can work against you as well as for you. Before deciding to trade foreign exchange you should carefully consider your investment objectives, level of experience and risk appetite.
The possibility exists that you could sustain a loss of some or all of your initial investment and therefore you should not invest money that you cannot afford to lose.
You should be aware of all the risks associated with foreign exchange trading, and seek advice from an independent financial advisor.
DISCLAIMER:
Any opinions, news, research, analyses, prices or other information discussed in this presentation or linked to from this presentation are provided as general market commentary and do not constitute investment advice.
Sonicr Mastery Team does not accept liability for any loss or damage, including without limitation to, any loss of profit, which may arise directly or indirectly from use of or reliance on such information.


CityDev key levels to watchPrice is testing a key support where we could see a pullback to test our resistance level, as long as prices hold below the descending trend line, overall direction remains bearish for me, a break below this key support area could see a further drop to our next support level.


SingTel is testing support, wait for break above trend line firsPrice is sitting on a key support level and a break above the trend line could provide the bullish confirmation, currently I am keeping a close watch on how prices play out and would not consider any long positions before the break of the descending trend line
